Updated on • 17 Sep 2024
DJI Thermal Analysis Tool: A Guide
A guide to the DJI Thermal Analysis Tool, a free software package to analyse radiometric thermal drone data. The DJI Thermal Analysis Tool is compatible with a range of DJI solutions, including the Mavic 3 Thermal, M30T, and H20 payloads fo ... Read More
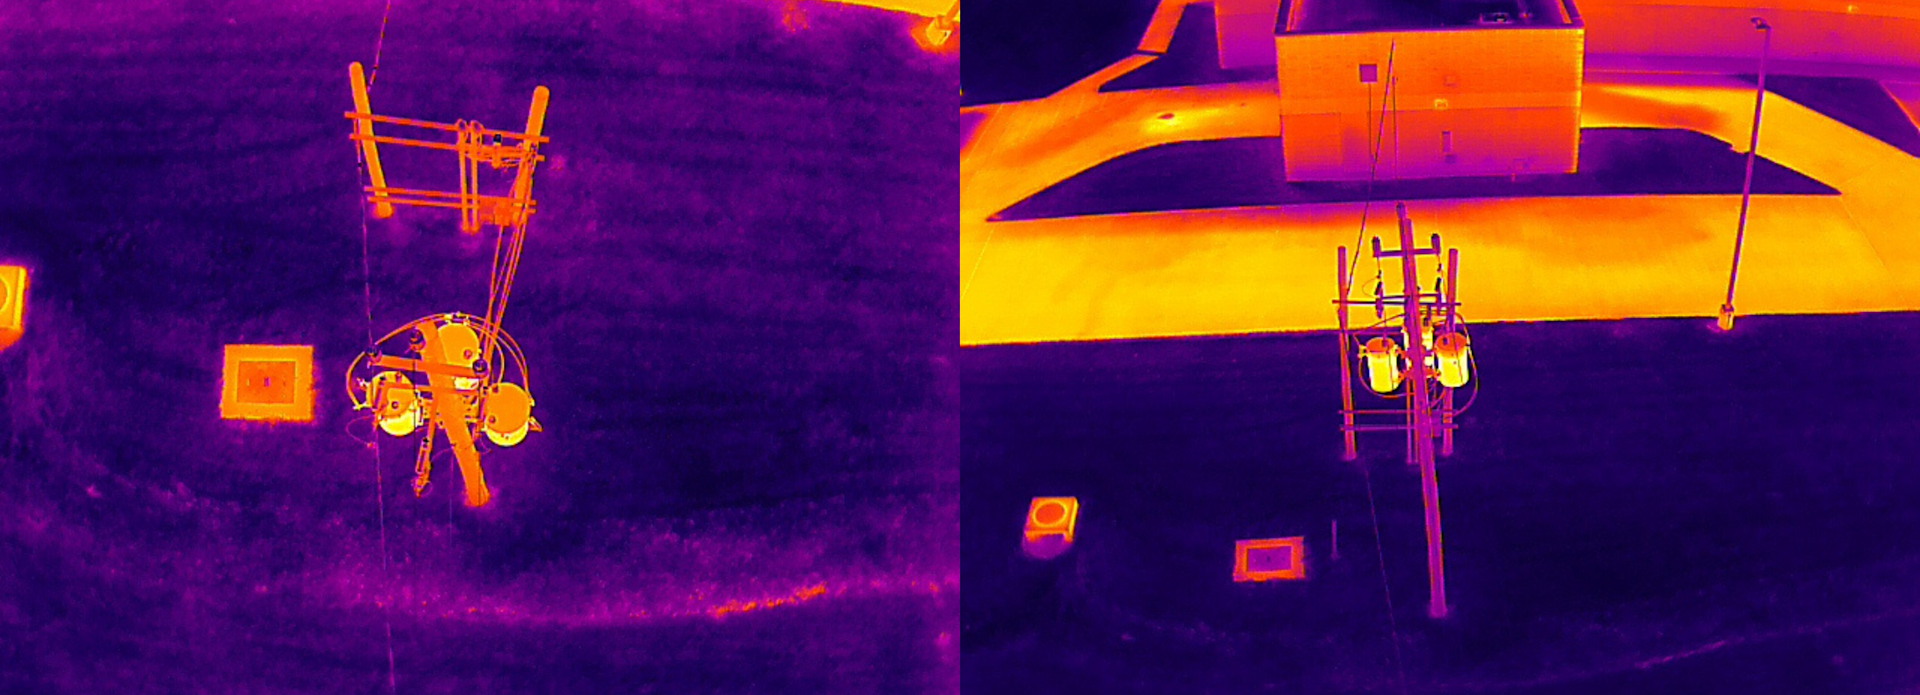
Process and analyse radiometric thermal drone imagery with the DJI Thermal Analysis Tool;
This free software package can be used across a range of industry verticals and enables users to identify specific temperature information or abnormalities within a data set;
Thermal insights can be vital for a range of enterprise operations, including preventing or addressing major issues in critical infrastructure;
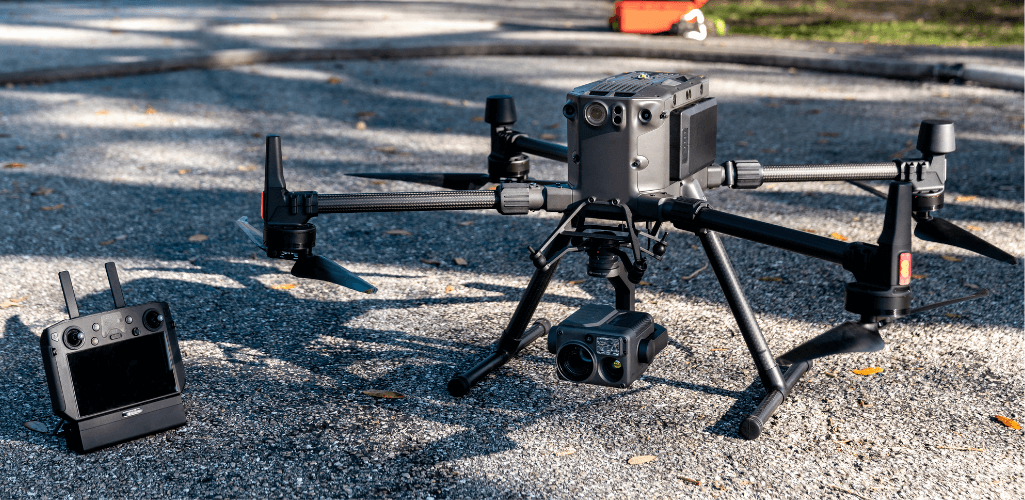
The DJI Thermal Analysis Tool is compatible with the DJI Mavic 3 Thermal, DJI M30T, the H20T and H20N payloads for the M300 Series, and the DJI Mavic 2 Enterprise Advanced;
Firmware update (DJI Thermal Analysis Tool 3.0 - July 2023): Key new features include added support for batch parameter adjustment, and enhanced clarity of measurements for better display.
The DJI Thermal Analysis Tool is a free software solution which enables operators of DJI drones to process and analyse their radiometric thermal drone imagery.
It is a particularly powerful tool for identifying temperature information of specific/critical areas of a data set - which is ideal for detecting and pinpointing temperature abnormalities. This in turn helps to prevent or address major incidents - spotting issues before it is too late.
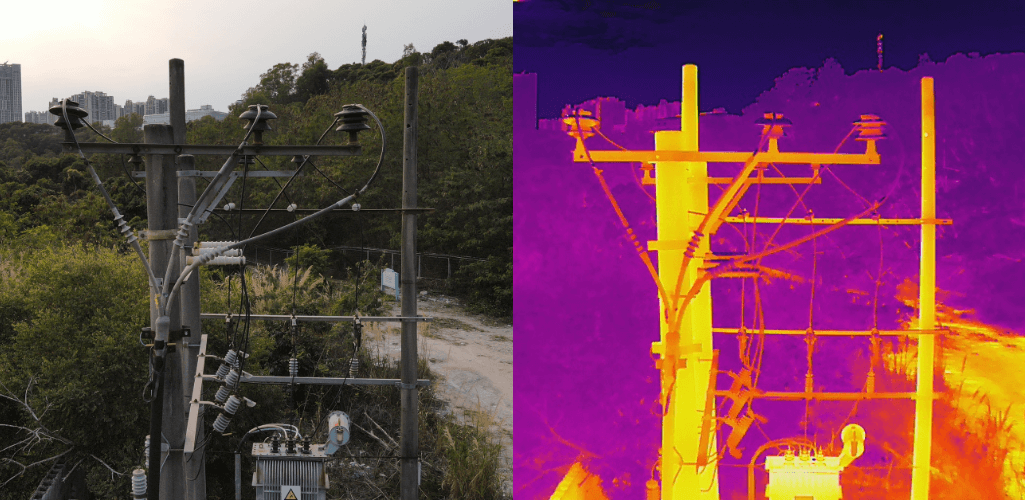
The programme is beneficial for a variety of applications, such as monitoring energy equipment, infrastructure inspection, scientific research, and civil surveying.
What's New: DJI Thermal Analysis Tool 3.0 Firmware Update
In July 2023, DJI released a firmware update (v3.1.0) for the DJI Thermal Analysis Tool.
What's New
Adds support for the batch adjustment of parameters. This allows users to change the parameters of multiple images with one click, instead of having to change each individual image. This enables the bulk change of parameters such as Distance; Humidity; Emissivity; and Reflected Temperature. These parameters will be discussed in more detail later in this article.
Supports the display of latitude and longitude.
Supports the display of true minimum and maximum temperatures.
Enhanced clarity of measurements for better display.
Optimised display of measurements to resolve overflow issues at the edges.
View image coordinates.
What's Fixed
Fixed the improper UI layout of line temperature measurements.
Fixed the issue where the pop-up window does not appear exactly at the location of the mouse click.
Which Drones/Cameras Are Compatible With The DJI Thermal Analysis Tool?
The DJI Thermal Analysis Tool 3.0 is compatible with:
Zenmuse H20T and Zenmuse H20N for DJI M300 Series
DJI Thermal Analysis Tool: Conducting Analysis
After collecting the data from the thermal drone, it is time to conduct analysis on it.
The DJI Thermal Analysis Tool offers users several features to collect detailed thermal insights.
Importing Images
Click Pic Preview on the Home page and select the folder with the infrared images to be analysed. The preview images appear as below.
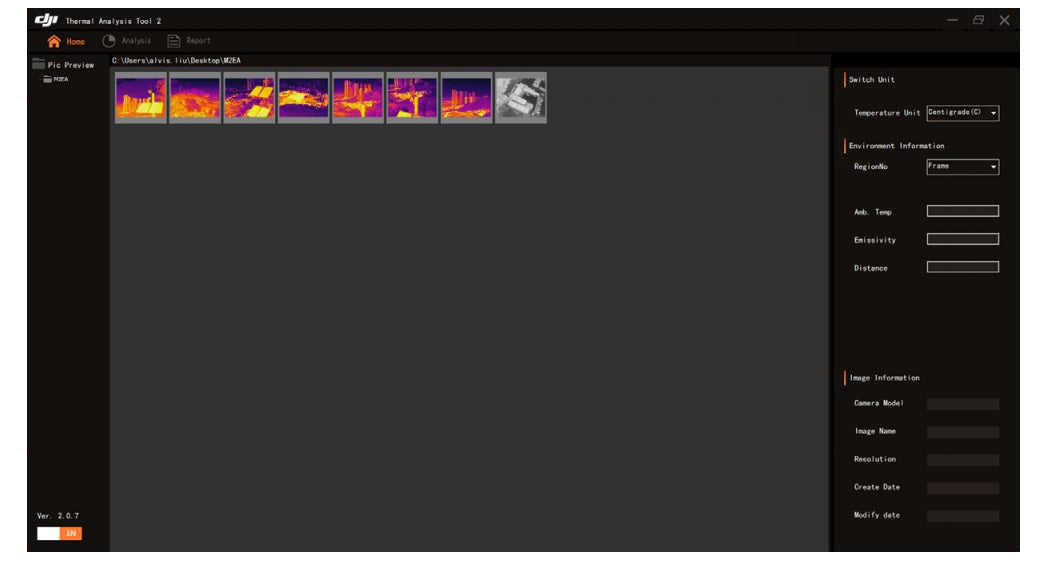
Click the image. The interface on the right displays the environmental and image information. Double-click the image to enter the Analysis page.
Colour Palettes
The DJI Thermal Analysis Tool enables users to toggle between a range of colour palettes to interpret their data.
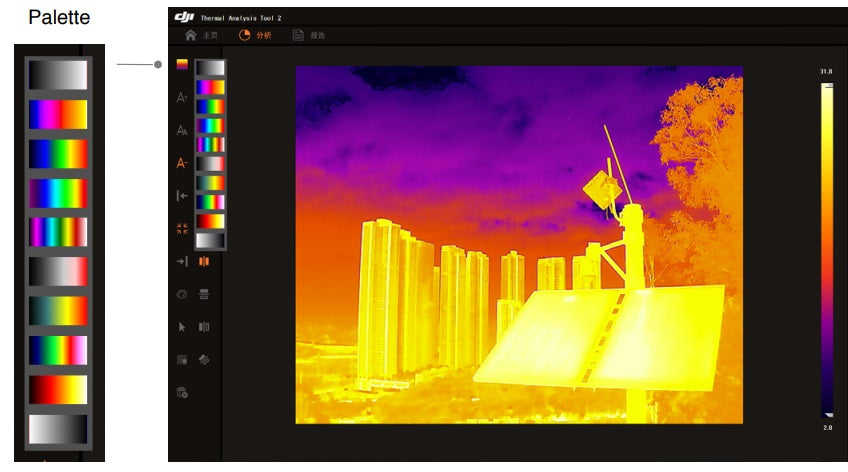
The temperature range of the image is mapped to 256 colours and displayed in an 8-bit JPEG image.
Palette options include:
Palette | Description |
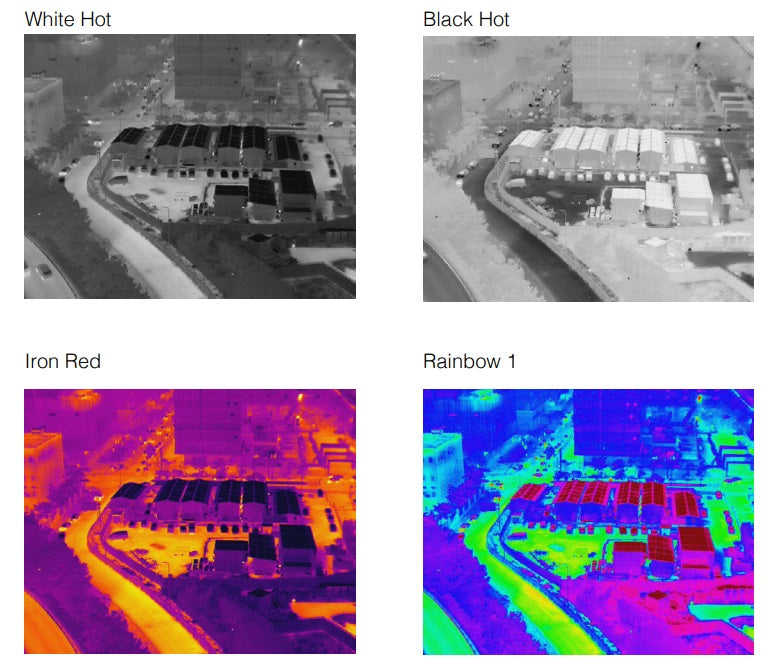
White Hot | The most commonly used pseudo colour, using white for high temperatures and black for low temperatures, which is a natural association for people. |
Fulgurite | Dark red represents low temperatures and white represents high temperatures. The warm tone of this palette aligns with people’s association with hot temperatures. |
Iron Red | This palette displays nuanced differences in heat signatures, quickly displaying anomalies and human bodies. Hotter objects appear as light warm colours and colder objects appear as dark cool colours. |
Hot Iron | Red represents high temperatures, and cool colours represent low temperatures. It is able to identify hot targets quickly, while showing the details of cool targets. |
Medical | This palette shows nuanced differences in temperatures, and is therefore ideal for scenarios with small temperature changes. In environments with low contrast, it is still able to detect objects and slight temperature changes. It is mainly used in the medical field for human body temperatures |
Arctic | Uses the same palette as Medical, except switching the purple for a cool blue to better reflect temperature changes |
Rainbow 1 | Similar to Medical, it reduces the warm colour ratio and increases the cold colour ratio for high temperature targets to better show the details of cool targets. |
Rainbow 2 | The colour transition is reduced, the warm and cold colours are moderately proportioned, which can show the details of high and low temperature targets at the same time. |
Tint | Uses black and white for low temperatures and bright red for high temperatures, it is able to detect high temperature targets quickly. Mainly used for high-contrast environments, ideal for quickly and accurately identifying high temperature targets at night. |
Black Hot | The opposite to White Hot, using black for warmer objects and white for cooler objects. The heat distribution of high temperature targets can be better observed when outdoors. |
Different palettes applied to the same example are show below.
The chroma bar displays the adaptive temperature range of the thermal image with the selected parameter settings. Drag the two ends of the chroma bar to adjust the colour scale of the pseudo colour to highlight objects in a specific temperature range.
Area Measurements
One of the key features of the DJI Thermal Analysis Tool is its ability to allow users to analyse and compare specific temperatures and differences in temperatures in an isolated part of a dataset.
There are numerous ways of doing this:
Spot Meter: Click and left-click the point that needs to be measured in the image. The temperature of that point will be displayed. Drag the point to change the position to measure.
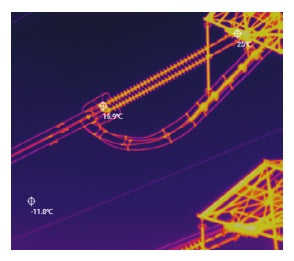
Line Measurement: Click to measure the highest, lowest, and average temperatures of a straight line.
Rectangle Measurement: Click to measure the highest, lowest, and average temperatures of a rectangular area.
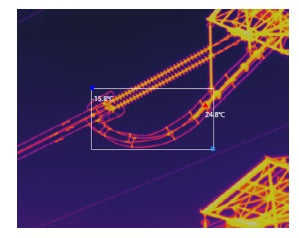
Circle Measurement: Tap to measure the highest, lowest, and average temperatures of a circle area.
Thermal Parameters
The environment parameters of each temperature measurement object can be adjusted to improve the accuracy of the analysis. These parameter settings include:
Distance: The distance from the camera to the target. The camera's default calibration distance is generally fixed during production. This is the distance at which temperature measurements are most accurate. Being too close or too far will result in bigger measurement errors.
Relative Humidity: Configure this parameter based on the actual environment. The default value of 70 means that the relative humidity is 70% and the value range is 20 to 100%.
Relative Emissivity: How strongly the surface of the object is emitting energy as thermal radiation.
Reflected Temperature: The surface of the target that is measured may reflect the energy radiated by surrounding objects. If there are no objects with extreme high or low temperatures nearby, set this parameter as the ambient temperature.
Extracting A Thermal Report
Once the temperature analysis is complete, users are able to extract a thermal report.
Click Export to go to the Report Screen, then click Export PDF or Export DOC to export a PDF or DOC report for the selected thermal image, which contains the measurements, parameter settings, image information, annotations, and remarks.
The report can include a customised logo and header.
Click Export Image to export a JPEG image which contains measurements and the chroma bar information.
Operating System Requirements
The DJI Thermal Analysis Tool 3.0 can only be run on 64-bit operating systems. Recommended operating systems include Windows 7, Windows 8, Windows 10, and later.
To download it, click here.
DJI Thermal Analysis Tool - Summary
The DJI Thermal Analysis Tool is specially designed for DJI's enterprise range of thermal drones and thermal cameras.
Thermal imagery is a powerful solution to identify fire hotspots or identify defects/issues of critical infrastructure and assets.
The DJI Thermal Analysis Tool enables users to gather in-depth insights about specific areas of their thermal data sets to make informed and quick decisions.

written by
James Willoughby
James joined heliguy™ in 2018 following a 13-year stint in print and online journalism, having worked on regional and weekly newspaper titles. He is responsible for spearheading heliguy™'s content strategy and social media delivery. James collaborates with DJI Enterprise's European marketing team to coordinate and produce case studies and helps organise events and webinars.