Case Studies
Published on 10 Oct 2023
James Willoughby
DJI L2 vs DJI L1: Comparison Datasets And Accuracy Reports
Explore the enhanced precision and detail of the DJI Zenmuse L2 in comparison to the L1.
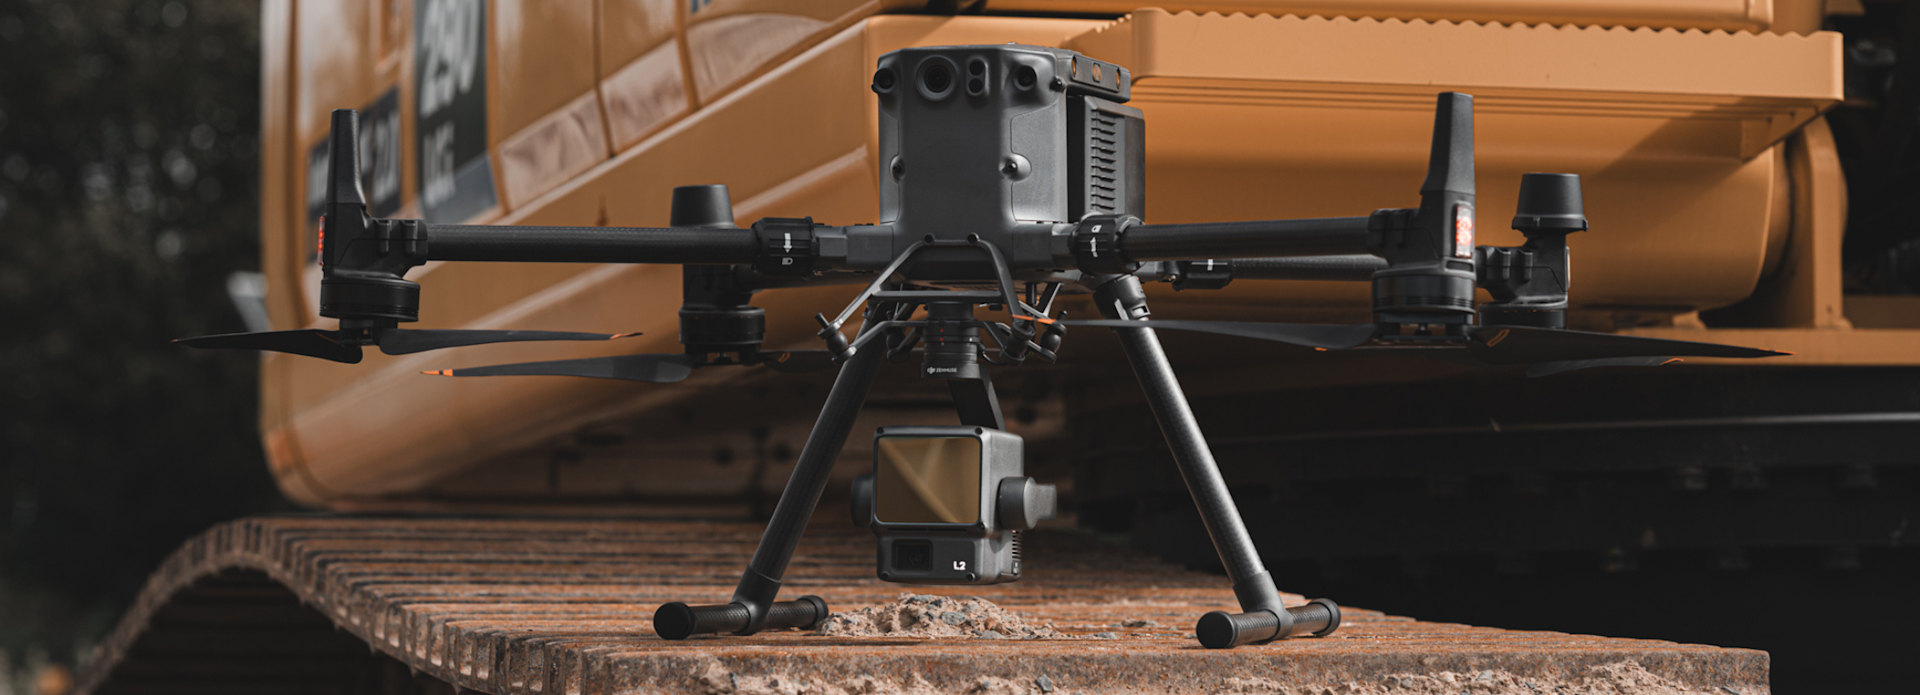
In-depth comparison between the new DJI Zenmuse L2 sensor and its predecessor, the L1;
Exclusive datasets collected by heliguy™ show the enhanced capabilities of the L2;
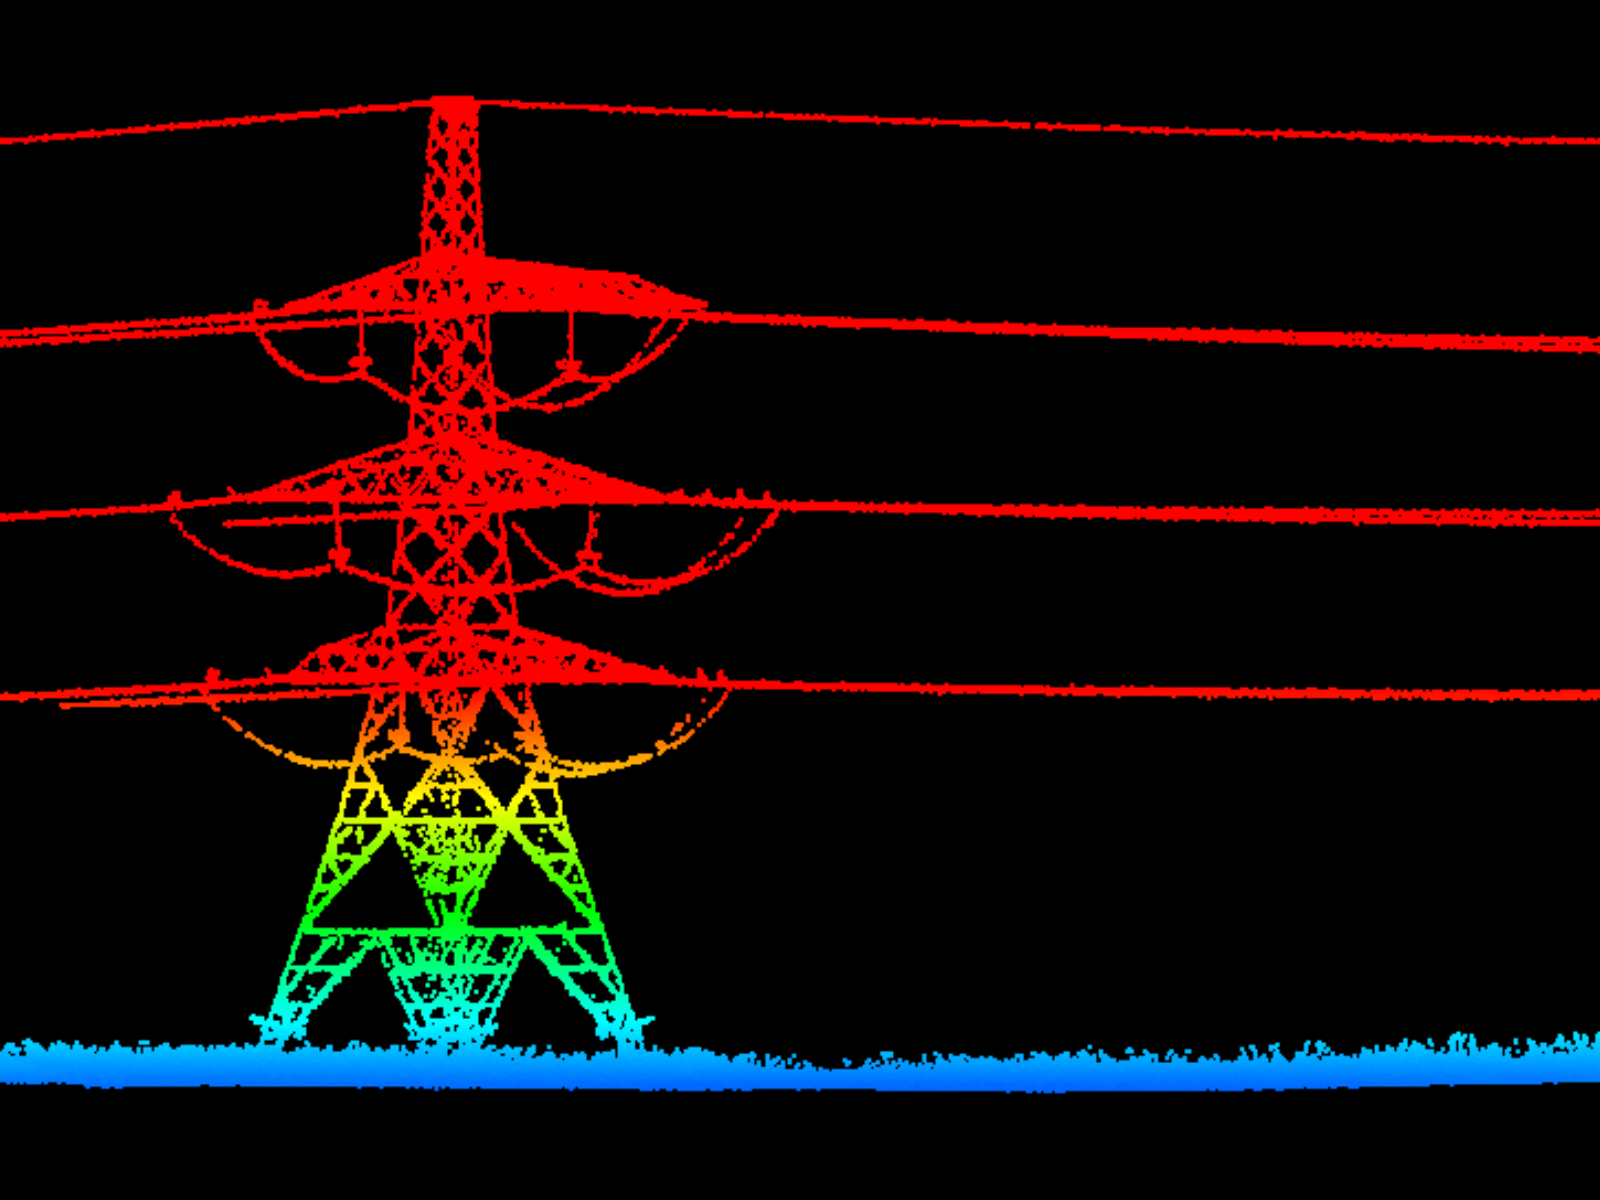
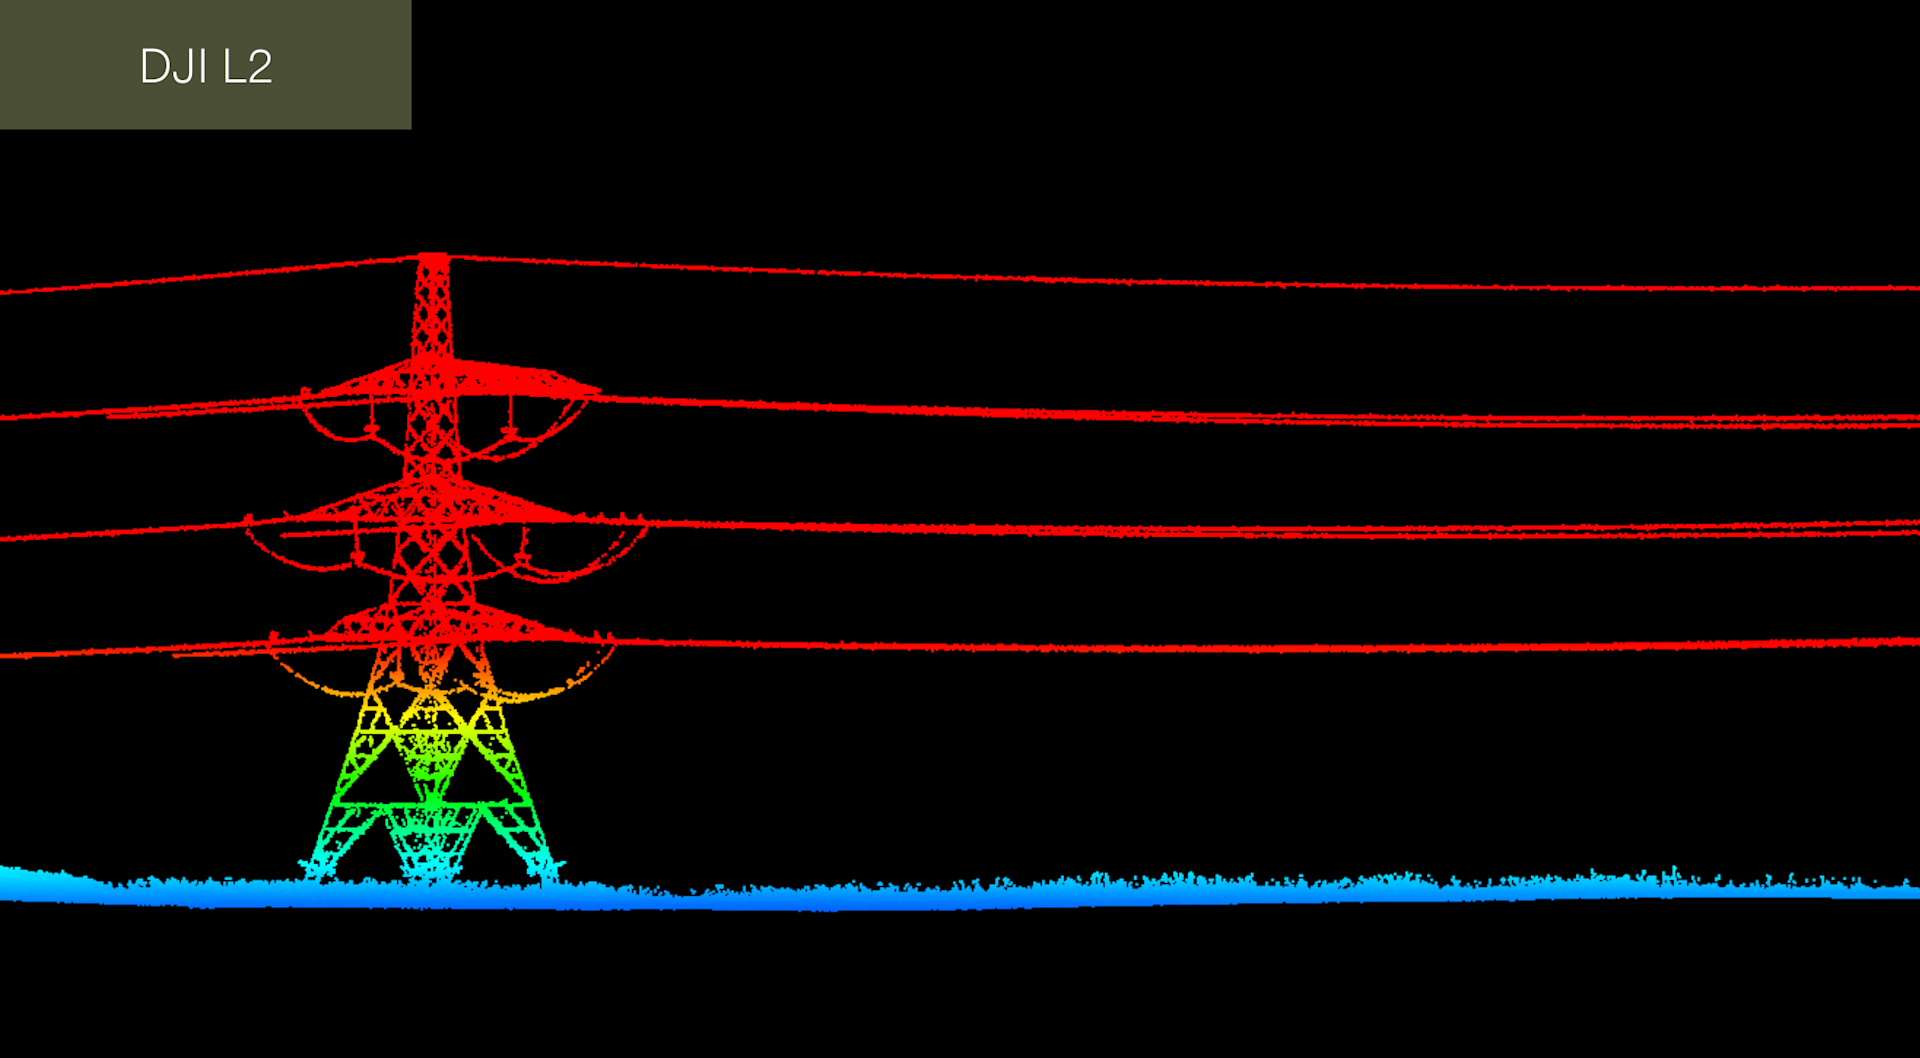
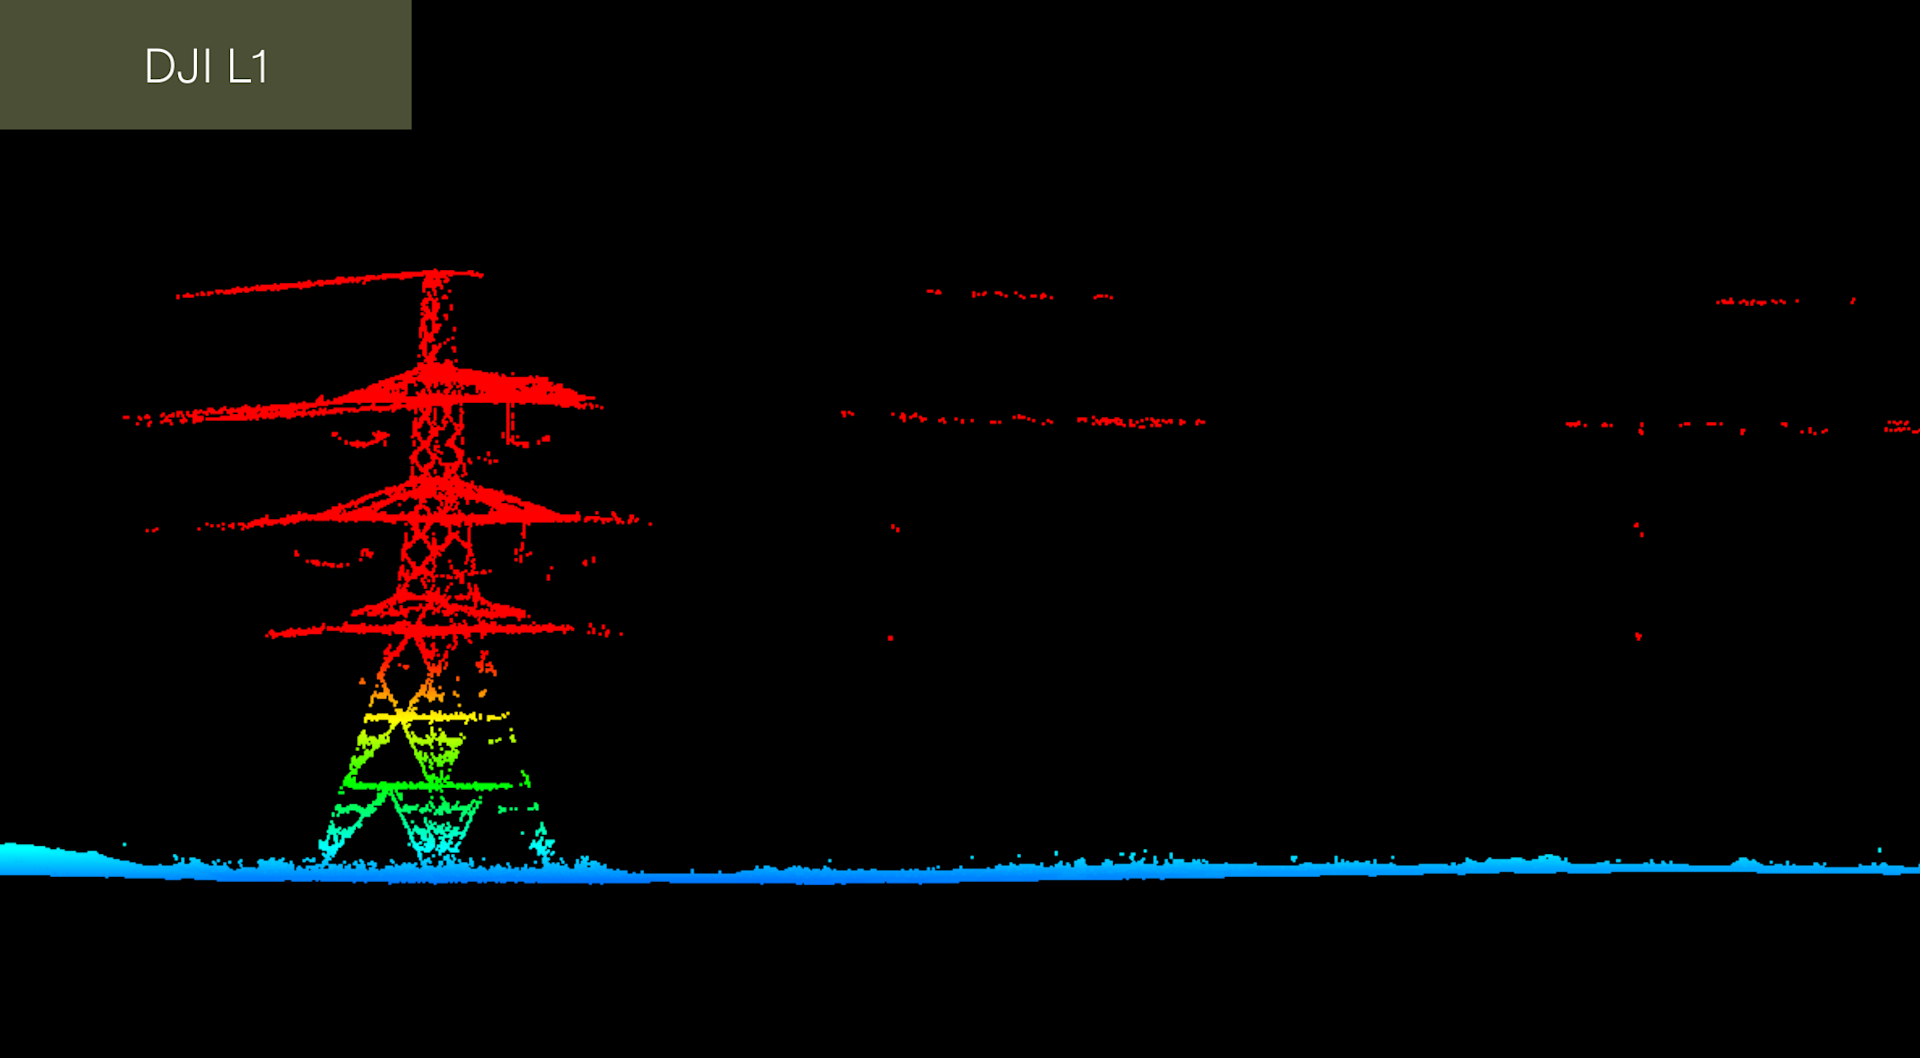
Vertical cross-section of powerlines show the L2's ability to better detect finer details, such as power cables;
Flying at 50 metres, the L2 achieved absolute vertical error of 44mm, compared to 51mm on the L1 - flight tests reveal;
L2 does not require IMU warm up, while the L1's pre-flight warm up can be as long as 10 minutes;
L2 has a larger RGB sensor, a higher sampling rate, offers more returns, and can fly at faster speeds to collect data, compared to the L1;
Pedro de Gouveia, Chief UAV Pilot at Murphy Geospatial, says he is impressed with the quality of the point cloud and the density that has come from the L2 versus the L1, calling the L2 a 'big step' up.
The DJI Zenmuse L2 offers increased accuracy, greater efficiency, and creates more robust point clouds compared to its predecessor, the L1 - exclusive datasets collected by heliguy™ reveal.
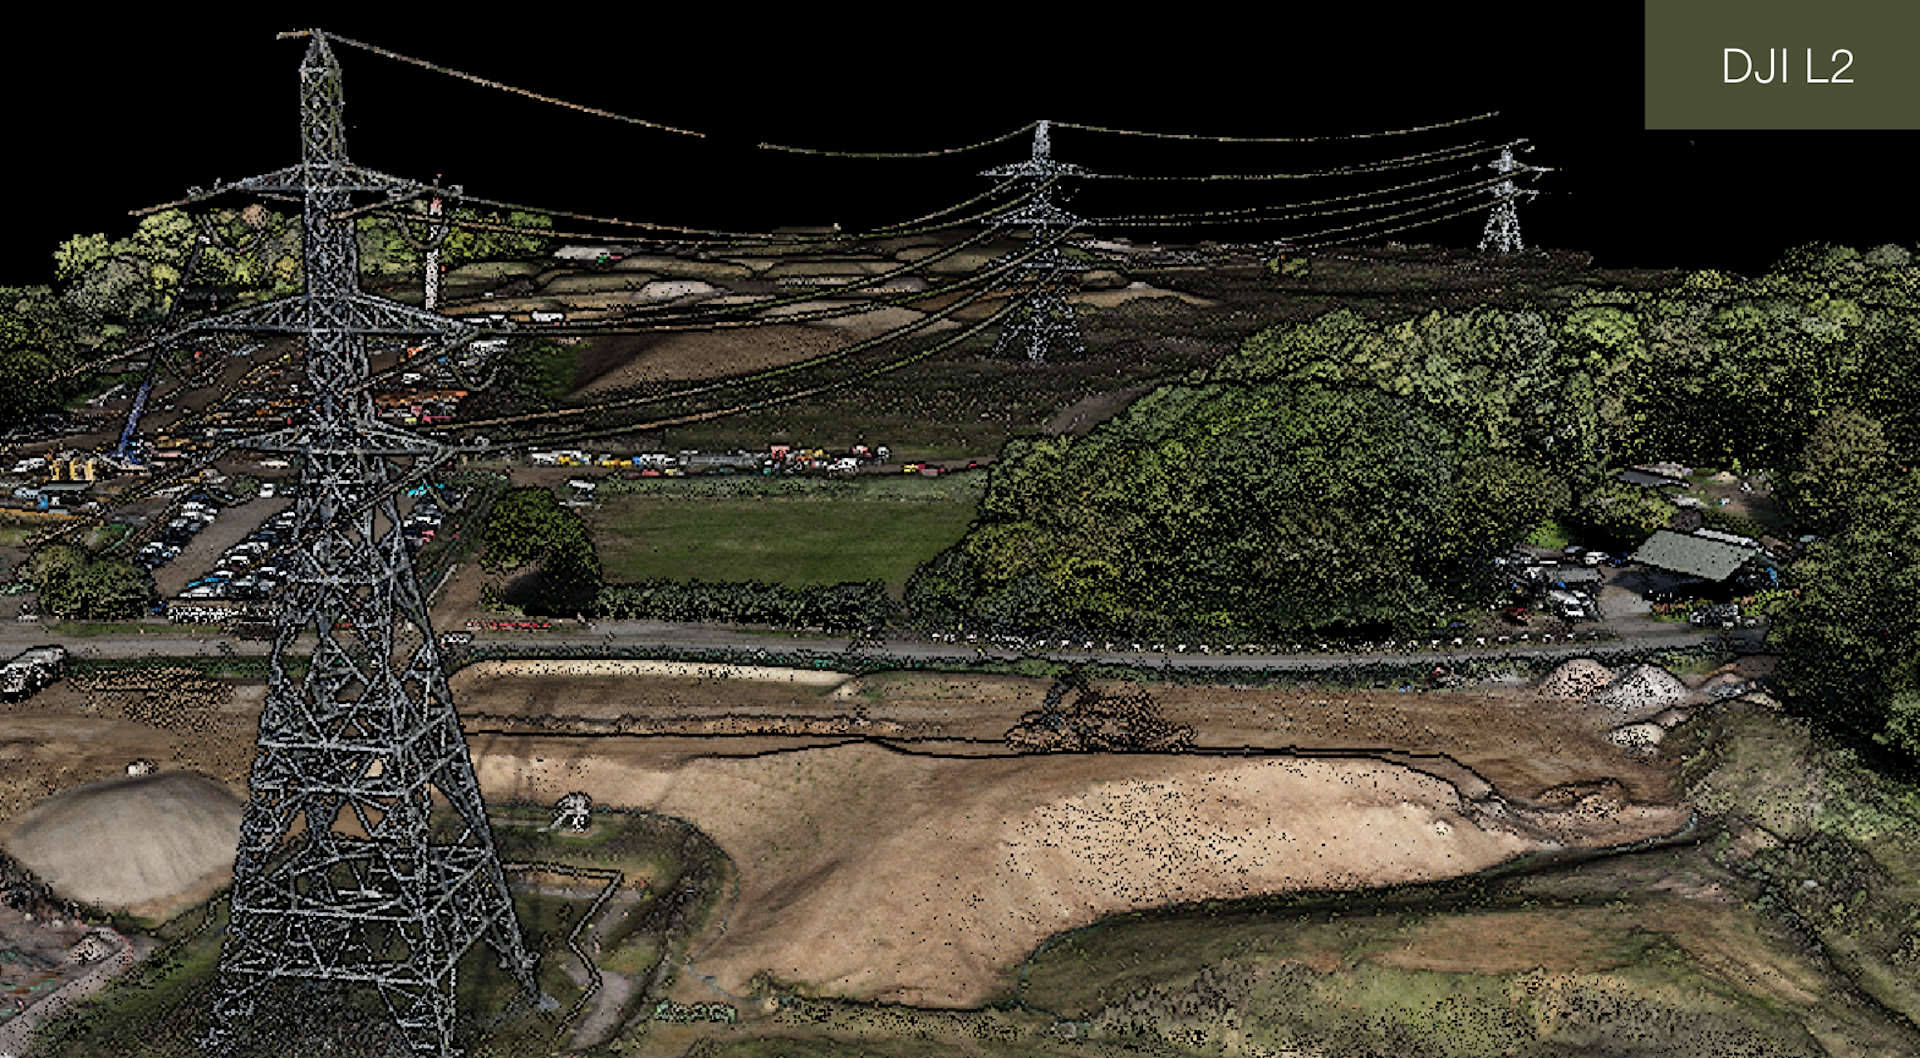
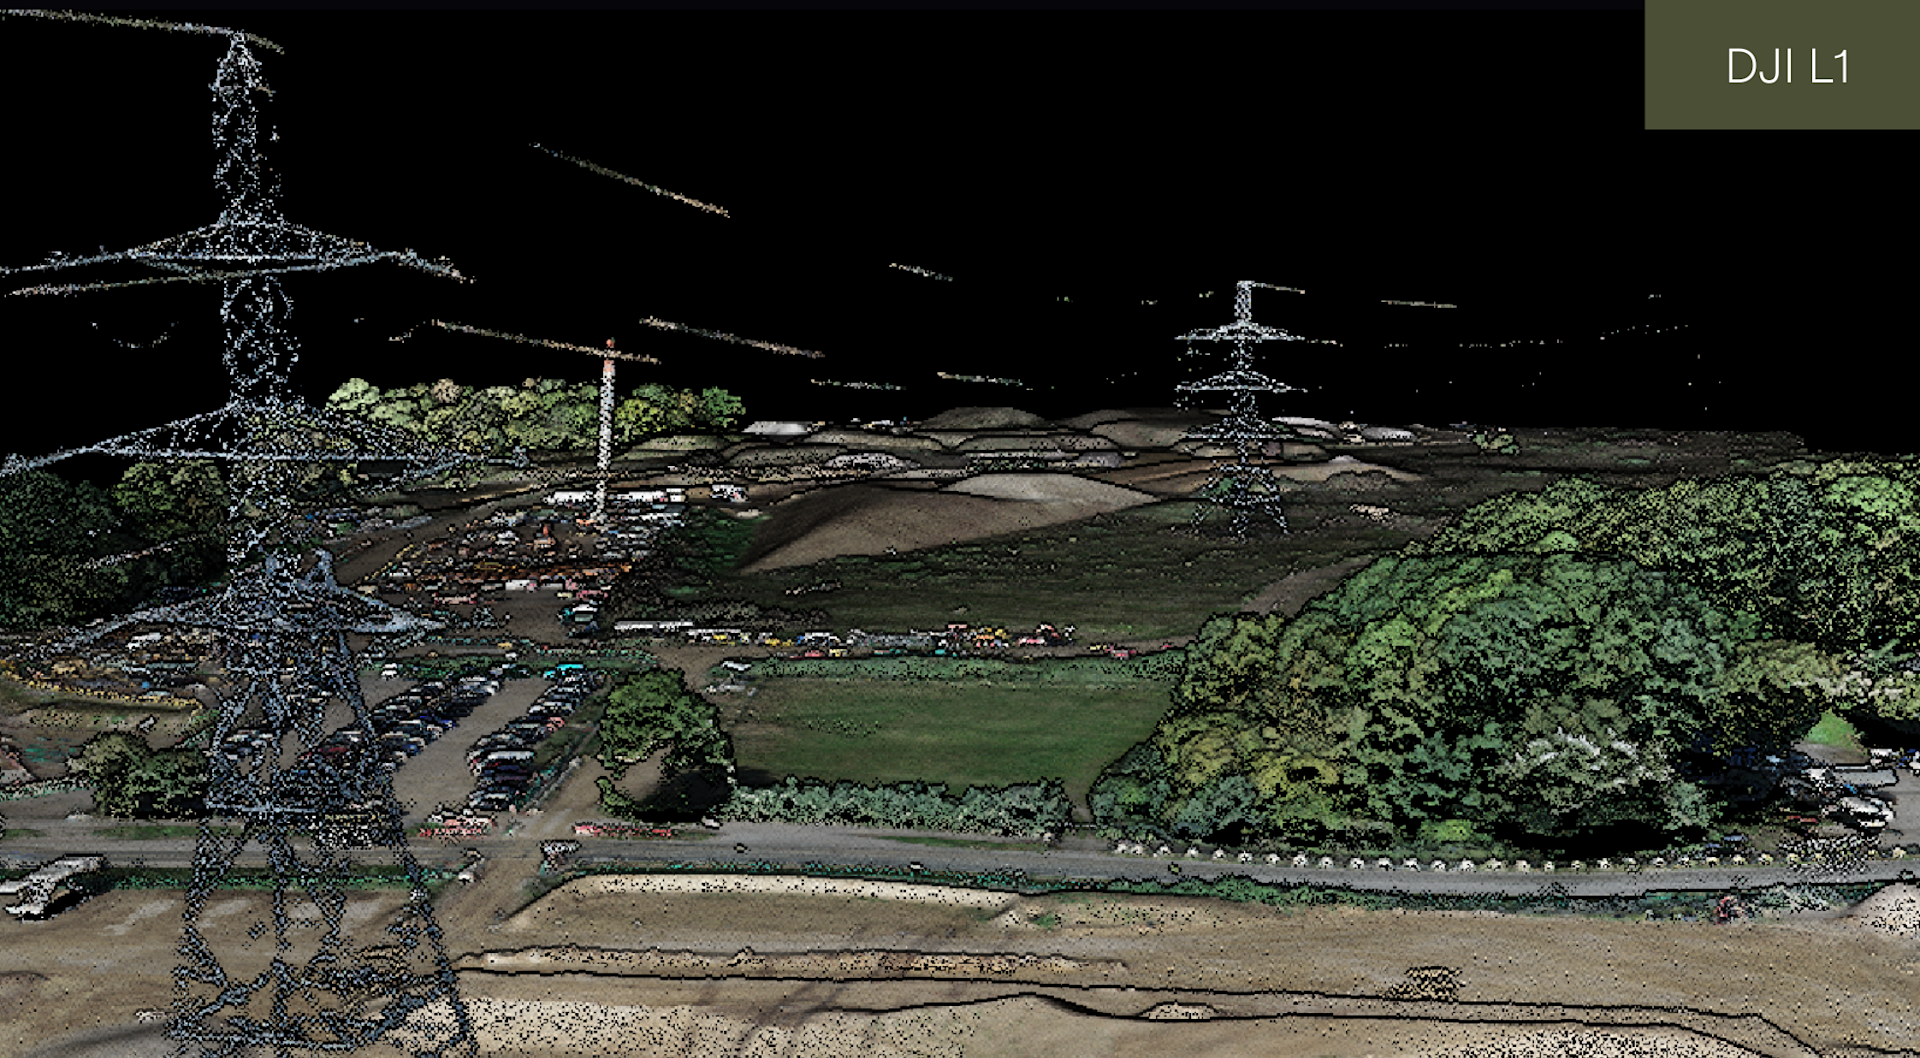
These two images showing identical cross-sections of powerlines demonstrate the L2's enhanced capabilities to detect small features on a survey site: In this case, the electrical wires are recreated in more detail.
And an accuracy report shows that the L2 can achieve 43mm absolute vertical error from 50 metres flight altitude, compared to 52mm on the L1.
In this blog, we'll take a look at the key upgrades of the L2 and demonstrate how they can enhance surveying workflows compared to the L1.
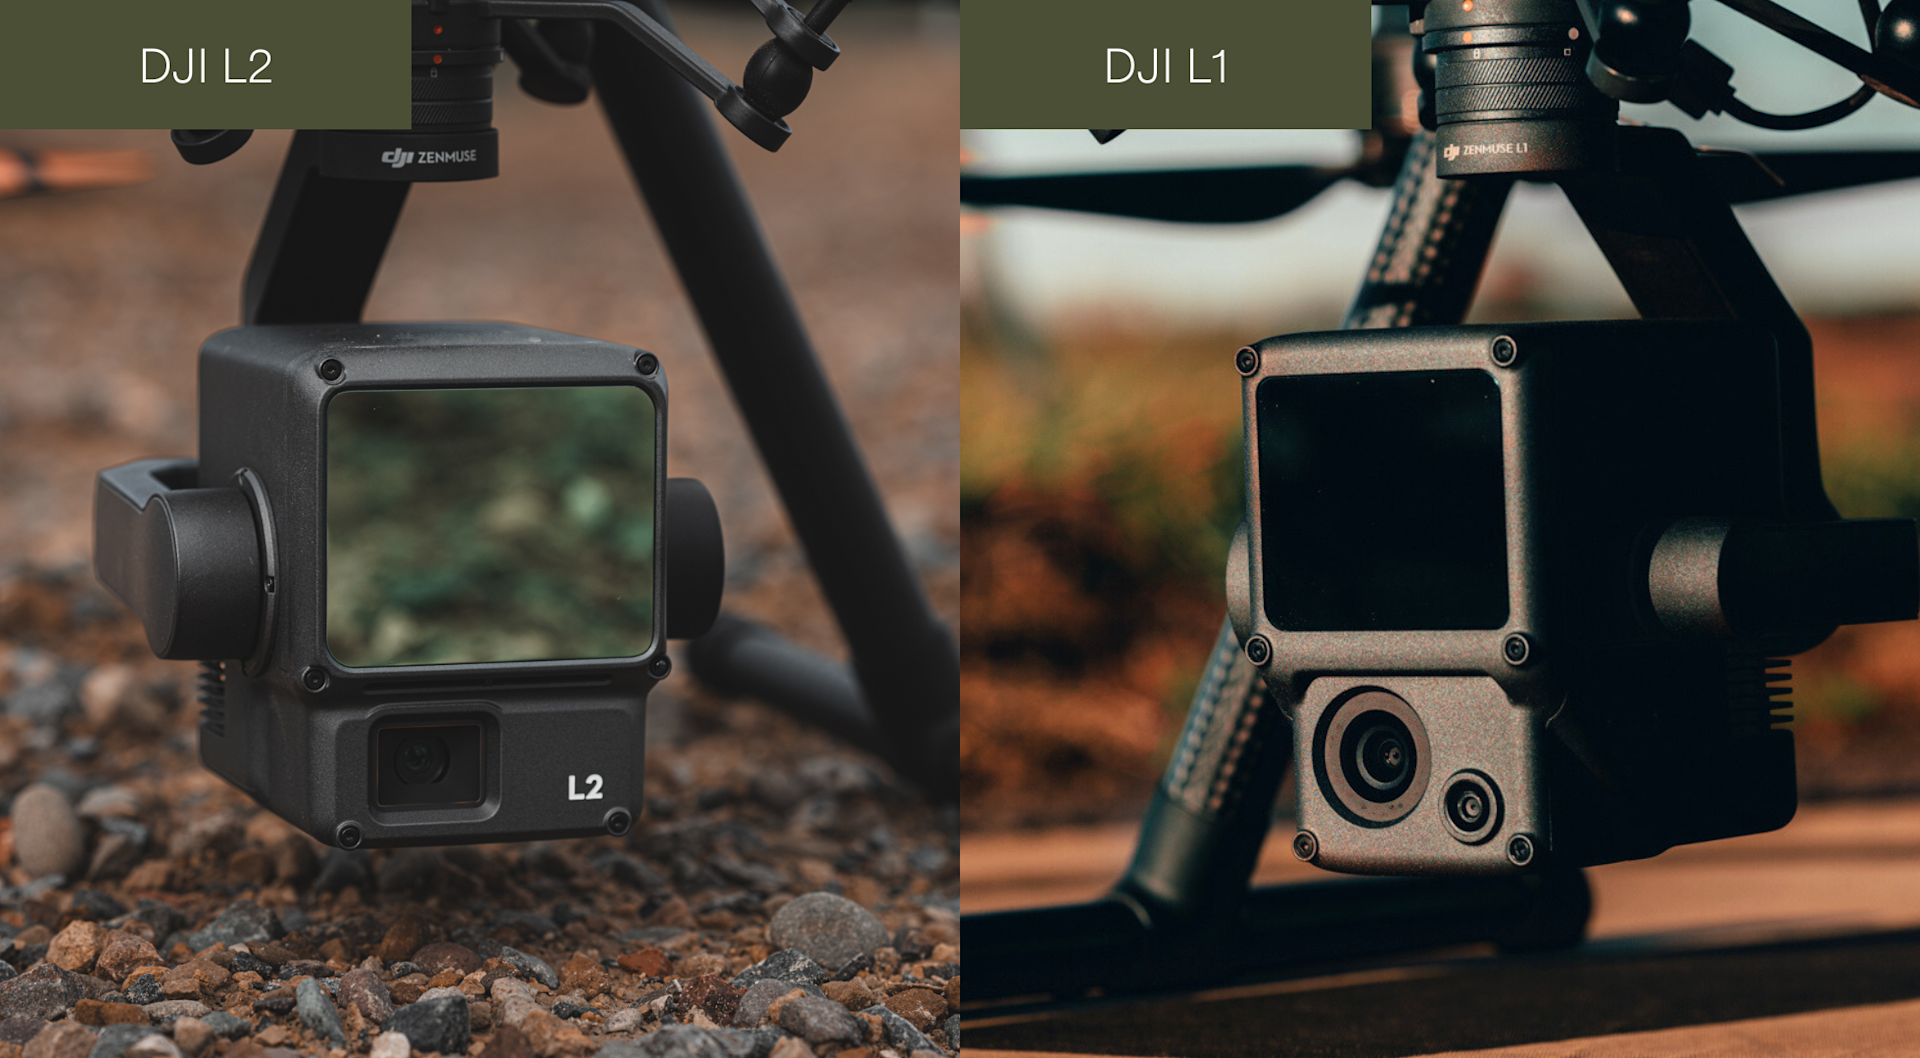
L2 vs L1: Key Specifications At A Glance
Before we delve into the datasets, let's take a look at the specifications of the L2 and the L1.
L2 | L1 | |
Dimensions | 155 x 128 x 176 mm | 152 x 110 x 169 mm |
Weight | 905±5 g | 930±10 g |
Power | 28W (typical) 58W (max) | 30W (typical) 60W (max) |
IP Rating | IP54 | IP54 |
Supported Aircraft | M300 RTK (requires DJI RC Plus); M350 RTK | M300 RTK; M350 RTK |
System Efficiency | The operating area of a single mission can reach 2.5km-squared. Relative altitude: 150m; Flight speed: 15m/s. | The operating area of a single mission can reach 2km-squared. Relative altitude: 100m; Flight speed 13m/s. |
Detection Range | 450m @ 50% reflectivity, 0klx; 250m @ 10% reflectivity, 100klx | 450m @ 80% reflectivity, 0 klx; 190m @ 10% reflectivity, 100 klx |
Point Rate | Single return: max. 240,000 pts/s; Multiple returns: max. 1,200,000 pts/s | Single return: max. 240,000 pts/s; Multiple return: max. 480,000 pts/s |
System Accuracy (DJI stated specs) | Horizontal: 5cm @ 150m; Vertical: 4cm @ 150m. Both at 150m flight altitude, flight speed 15m/s | Horizontal: 10cm @ 50m; Vertical: 5cm @ 50m. Both at 50m flight altitude, flight speed to 10 m/s. |
LiDAR Module: Ranging Accuracy | 2cm @ 150m | 3cm @ 100m |
Inertial Navigation System Accuracy | Yaw Accuracy: Real-time 0.2°, post-processing, 0.05°; Pitch/Roll Accuracy: Real-time 0.05°, post-processing, 0.025° | Yaw Accuracy: Real-time 0.3°, post-processing, 0.15°; Pitch/Roll Accuracy: Real-time 0.05°, post-processing, 0.025° |
Real-time Point Cloud Colouring Modes | Reflectivity, Height, Distance, RGB | Reflectivity, Height, Distance, RGB |
LiDAR: Maximum Returns Supported | 5 | 3 |
LIDAR: Maximum Sampling Frequency | 240kHz for all modes, including Penta | 240 kHz (single/dual echo mode); 160 kHz (triple-echo mode) |
LiDAR: Scan Modes (including FOV) | Repetitive scanning pattern: 70° x 3°; Non-repetitive scanning pattern: 70° x 75° | Repetitive scanning pattern: 70.4° x 4.5°; Non-repetitive scanning pattern: 70.4° x 77.2 |
RGB Mapping Camera: Sensor Size & Effective Pixels | 4/3 inch; 20MP; 0.7 seconds shooting interval | 1 inch; 20MP; 2 seconds (minimum) shooting interval |
RGB Mapping Camera: Shutter Speed | Mechanical Shutter: 2-1/2000 s; Electronic Shutter: 2-1/8000 s | Mechanical Shutter Speed: 1/2000 - 8 s; Electronic Shutter Speed: 1/8000 - 8 s |
RGB Mapping Camera: Video Resolution | 4K @ 30fps | 4K @ 30fps |
Recommended Data Capture Speed | 15m/s | 8m/s to 13m/s |
Pre-flight High-accuracy IMU Warm-up Required | No | Yes: 5-10 minutes |
Point cloud Real-time Preview | Support, point cloud rendering optimisation | Support |
As the table shows, the L1 and L2 feature a LiDAR module, an RGB sensor for photogrammetry and point-cloud colourisation, and a high-accuracy IMU.
But, the L2 - unveiled by DJI on October 10, 2023 - has some key improvements over the L1 (released 2020), such as:
Increased return rate and higher sampling rate - improving the L2's penetration and ability to detect small details.
Increased efficiency - fly further at a higher height, plus the L2 does not require a 5-10 minute period for the IMU to warm up.
The L2 has a more concentrated beam: The L2 laser spot size is 4 x 12 cm at 100 metres, which is 1/5th of the L1's laser spot size. This smaller, more concentrated laser creates denser point clouds.
The measuring range of the L2 has increased by 30%. The typical operating altitude can reach 150m and the detection range is longer.
Larger RGB mapping sensor with a faster shooting interval.
Better detection rate: Can detect objects at 50% reflectivity, while the L1 requires objects to have at least 80% reflectivity - from 450m.
Improved accuracy of the inertial navigation system and the manual route inertial navigation calibration interval has been increased by 67%.
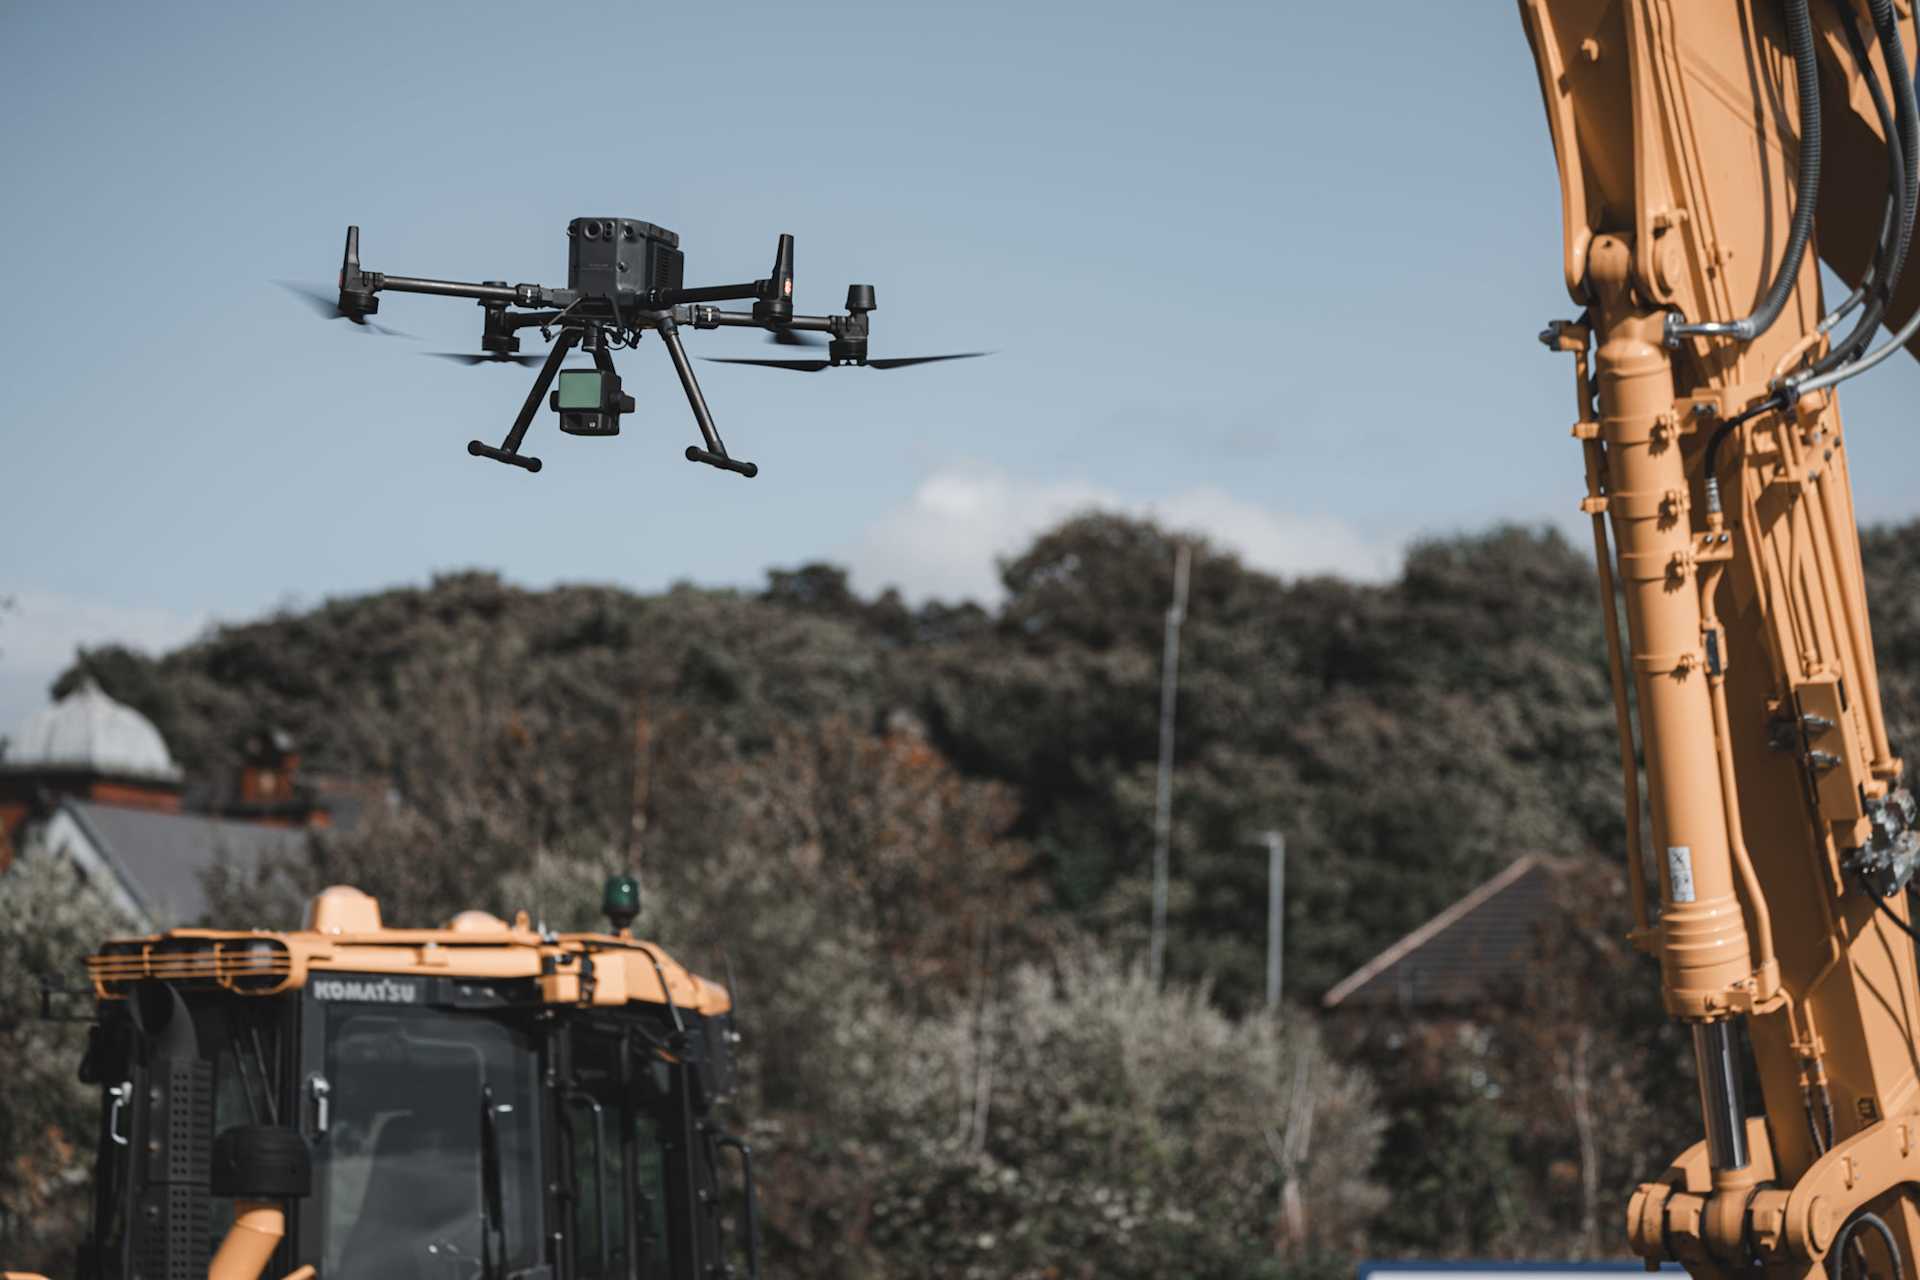
Due to the improvements of the L2, when operating under the same environment and flight parameters:
The ground point density of the L2 is more than 3 times that of the L1.
The thickness of L2 point cloud is 1/3 of L1.
Test Site One: Colne Valley Viaduct on HS2 Phase One
The Align JV (Bouygues Travaux Publics, Sir Robert McAlpine and VolkeFitzpatrick) is delivering the Central 1 (C1) section of HS2 Phase One, including a 3.4km viaduct across the Colne Valley.
We teamed up with Murphy Geospatial, an Align JV subcontractor, to fly the L2 and L1 at the viaduct’s south embankment site.
Murphy says it would use the L2 for:
High-density vegetation and where accurate ground levels are needed.
Building/urban environments where there are very fine/small features that would need to be recorded.
Quantity surveying, especially where the material or ground has high reflective properties/characteristics.
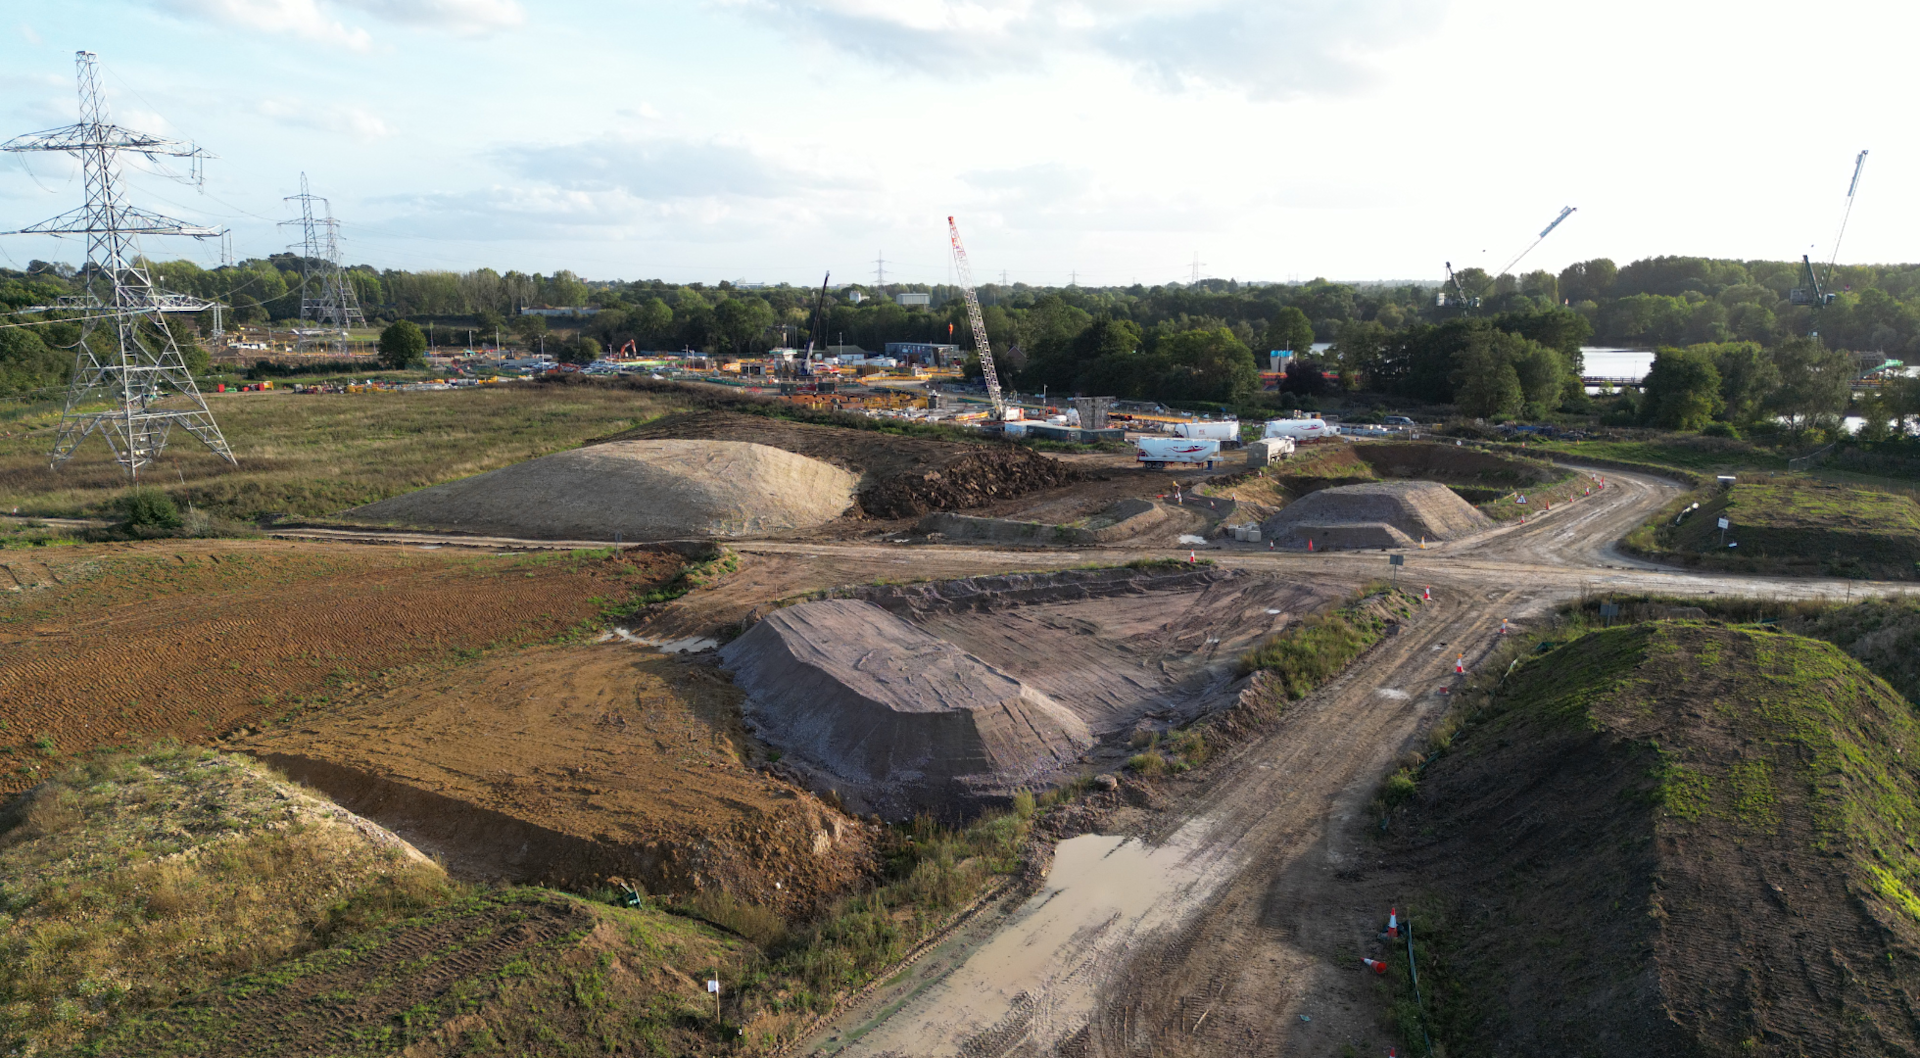
As such, it was an optimal trial location, containing vegetation, powerlines and stockpiles. It provided a good test bed for a LiDAR sensor.
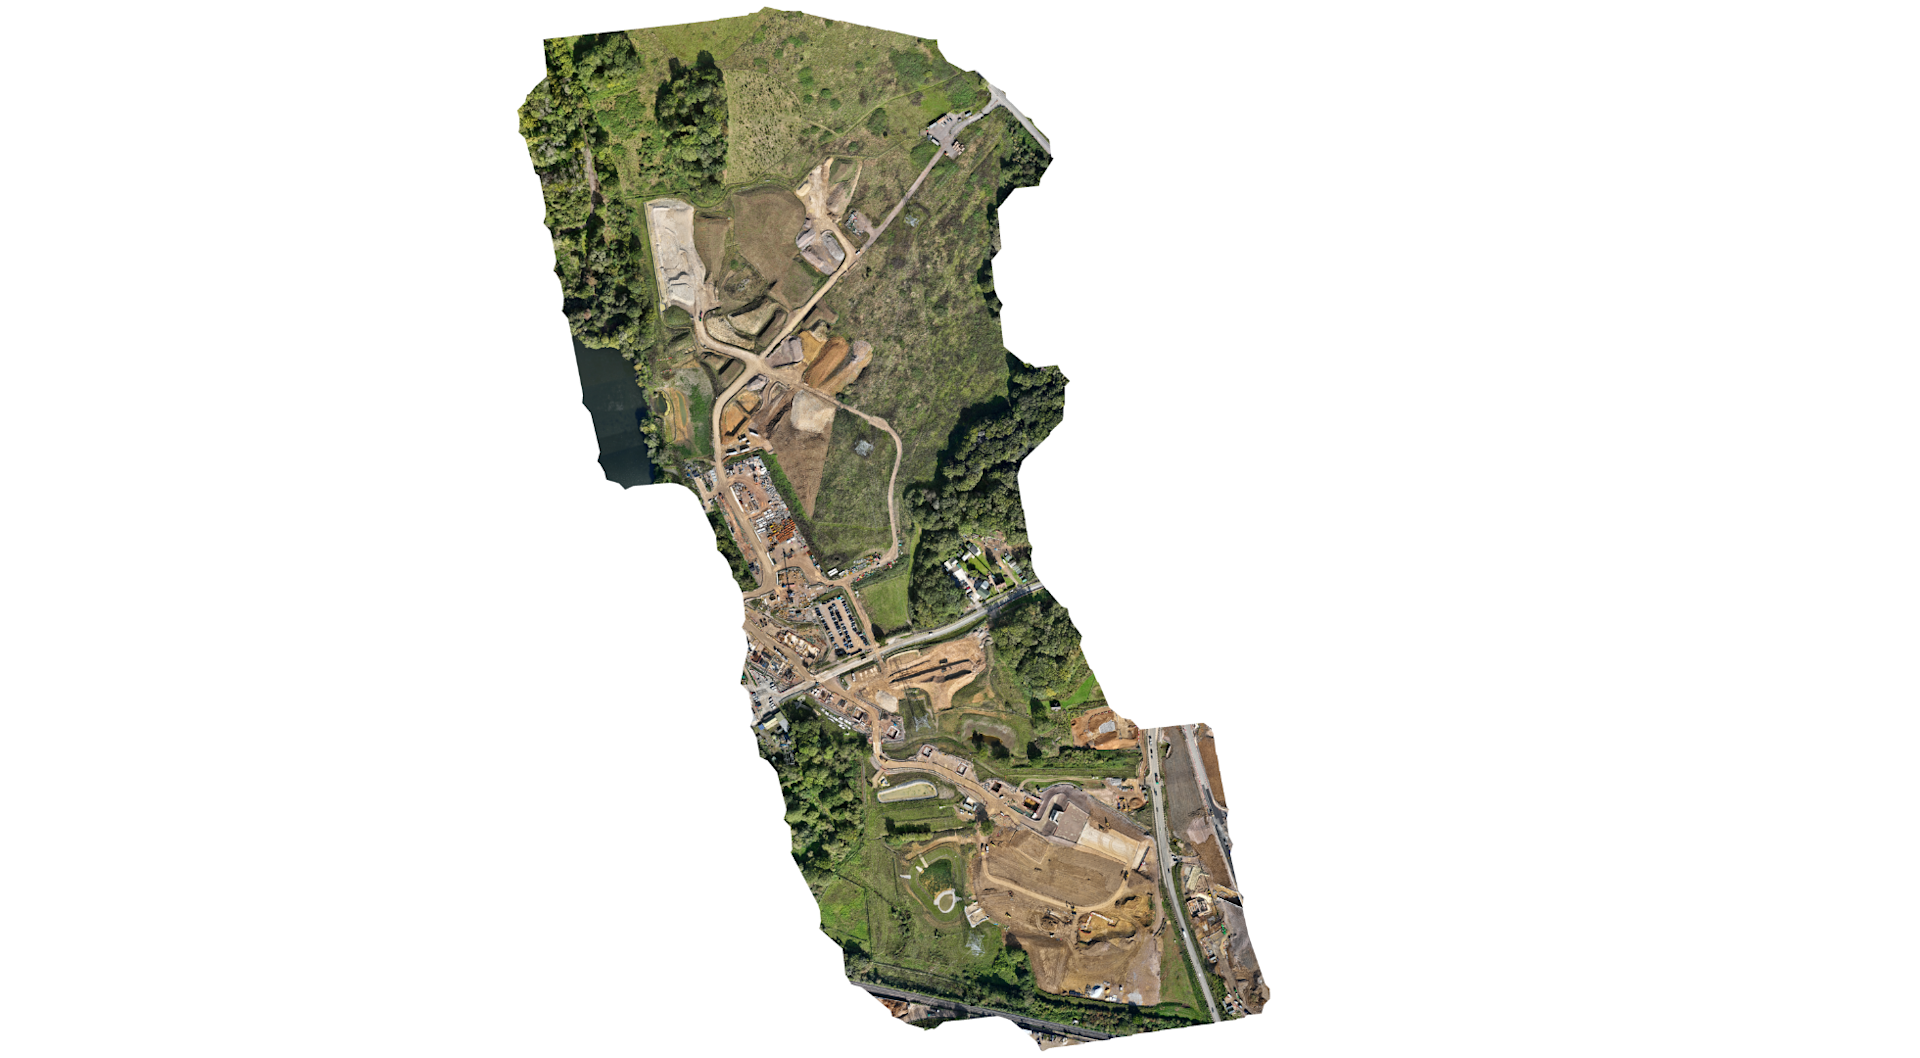
The site boundary is shown below, via a 2D orthomosaic produced using the L2's RGB camera.
The following parameters were set for the flights:
Parameter | L2 | L1 |
Overlap | 50% | 50% |
Speed | 8m/s | 8m/s |
Flight Height | 100m | 100m |
Return | Penta (5) | Triple (3) |
Sampling Rate | 240khz | 160khz |
Elevation Optimisation | Yes | Yes |
Scanning Type | Repetitive | Repetitive |
IMU Calibration | Yes | Yes |
Mission Type | 2D Nadir | 2D Nadir |
Photos | 334 | 325 |
GSD | 2.69cm | 2.73cm |
Mission Time | 24 min 27 sec Flight Time: 24 min 27 sec Pre-flight IMU warm-up: Not required | 32 min 50 sec Flight Time: 22 min 50 sec Pre-flight IMU warm-up: 10 minutes |
The parameters were identical, except for utilising the L2's increased return rate and sampling rate.
It is worth noting that the L2 can capture data at up to 15m/s, for greater efficiency, but in this case, we kept the speeds at 8m/s. The L1's recommended parameters range from 8m/s to 13m/s, depending on the mission scenario.
The missions were conducted at 100m flight altitude. We were restricted to this height due to the proximity of a local airfield.
The L1 flew for 22 minutes and 50 seconds, while the L2 was slightly longer at 24 minutes 27 seconds, but this is attributed to the fact that the mission was flown with a Penta return rate.
Overall, the mission with the L2 was shorter as it did not require a pre-flight IMU warm-up.
Powerline Inspection
LiDAR is particularly effective for powerline inspection: The rapid firing of laser pulses and the ability to conduct multiple returns from a single laser pulse affords higher spatial resolution.
This helps to capture more detailed information about complex structures like powerlines, including their shape and orientation, and better identify finer details.
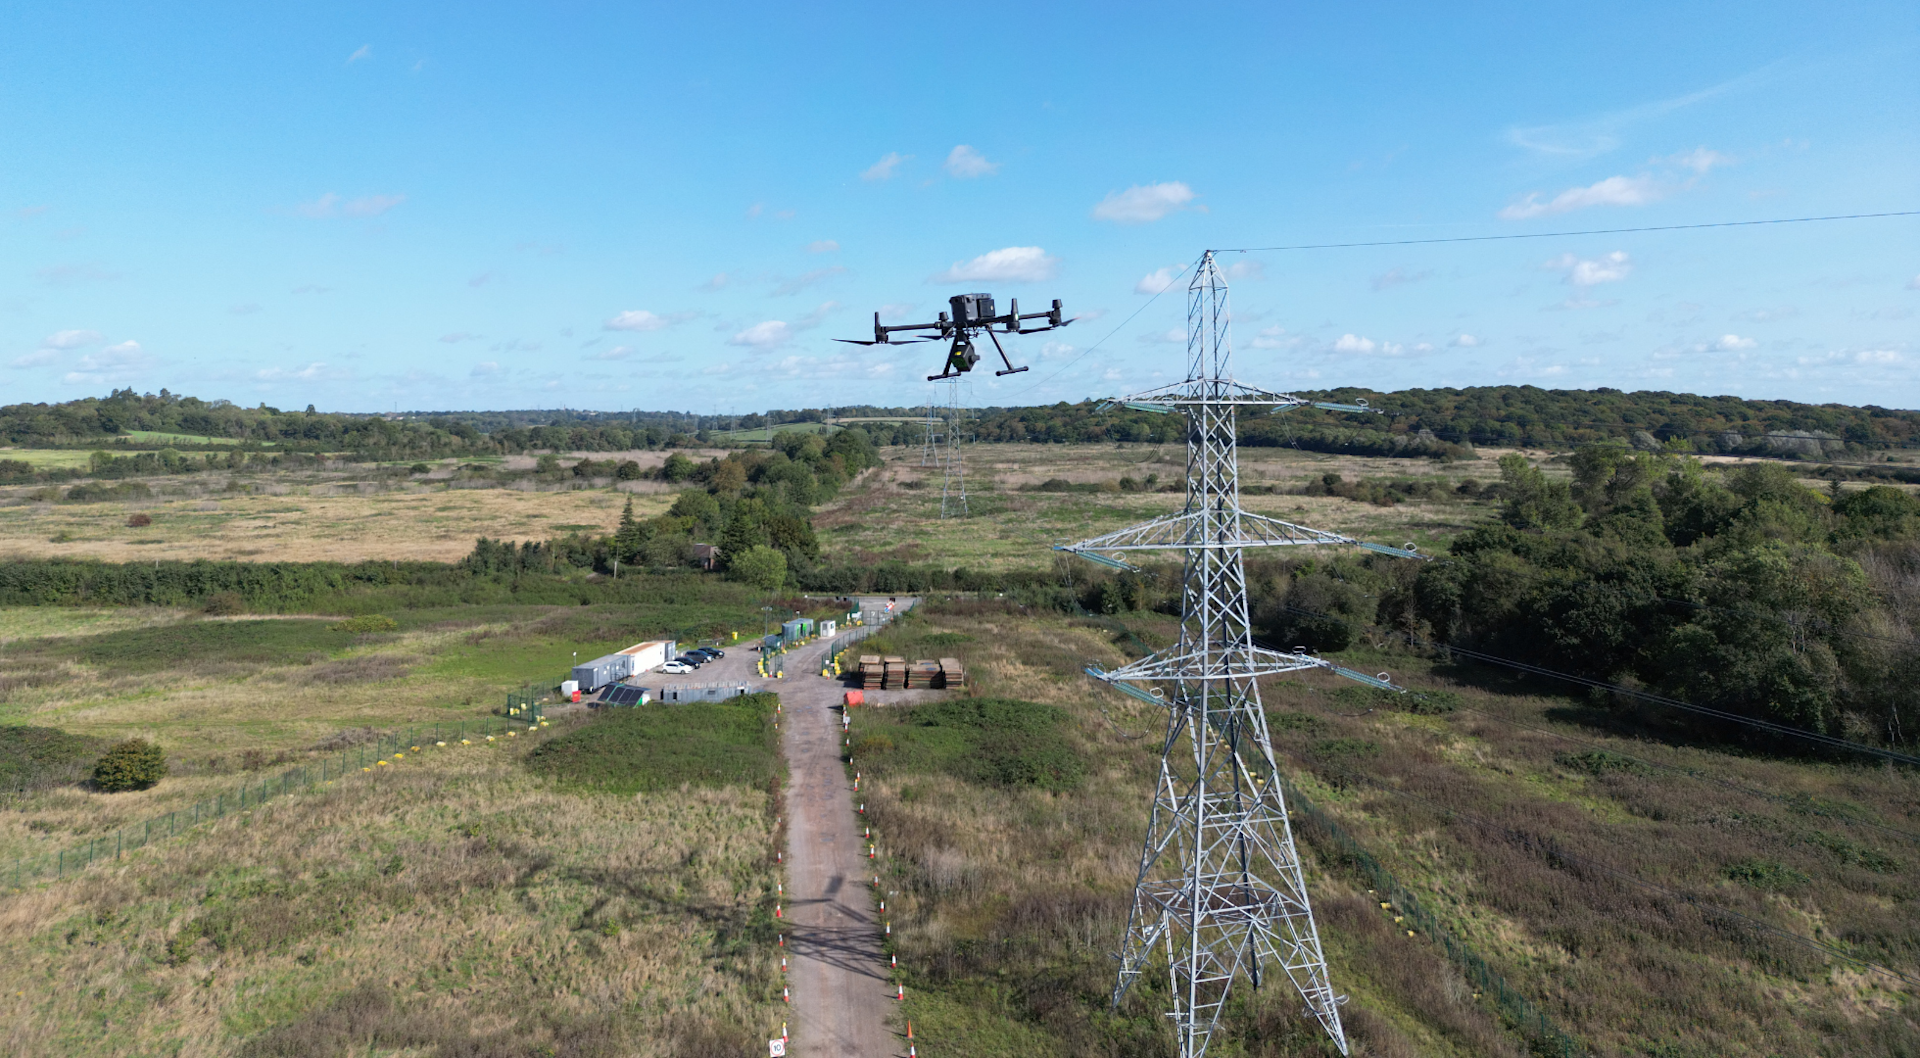
The image below shows the L2 mapping powerlines on the HS2 site.
And when comparing the results between the L2 and L1, it is clear that the L2 did a better job at detecting the cabling and the transmission towers on site - as these two screen shots, taken from DJI Terra, show.
The increased level of detail in the L2 data is also apparent in the top-down view below, using imagery from Terrasolid. Notice how the powerlines are more complete in the L2 dataset, yet almost non-existent with the L1.
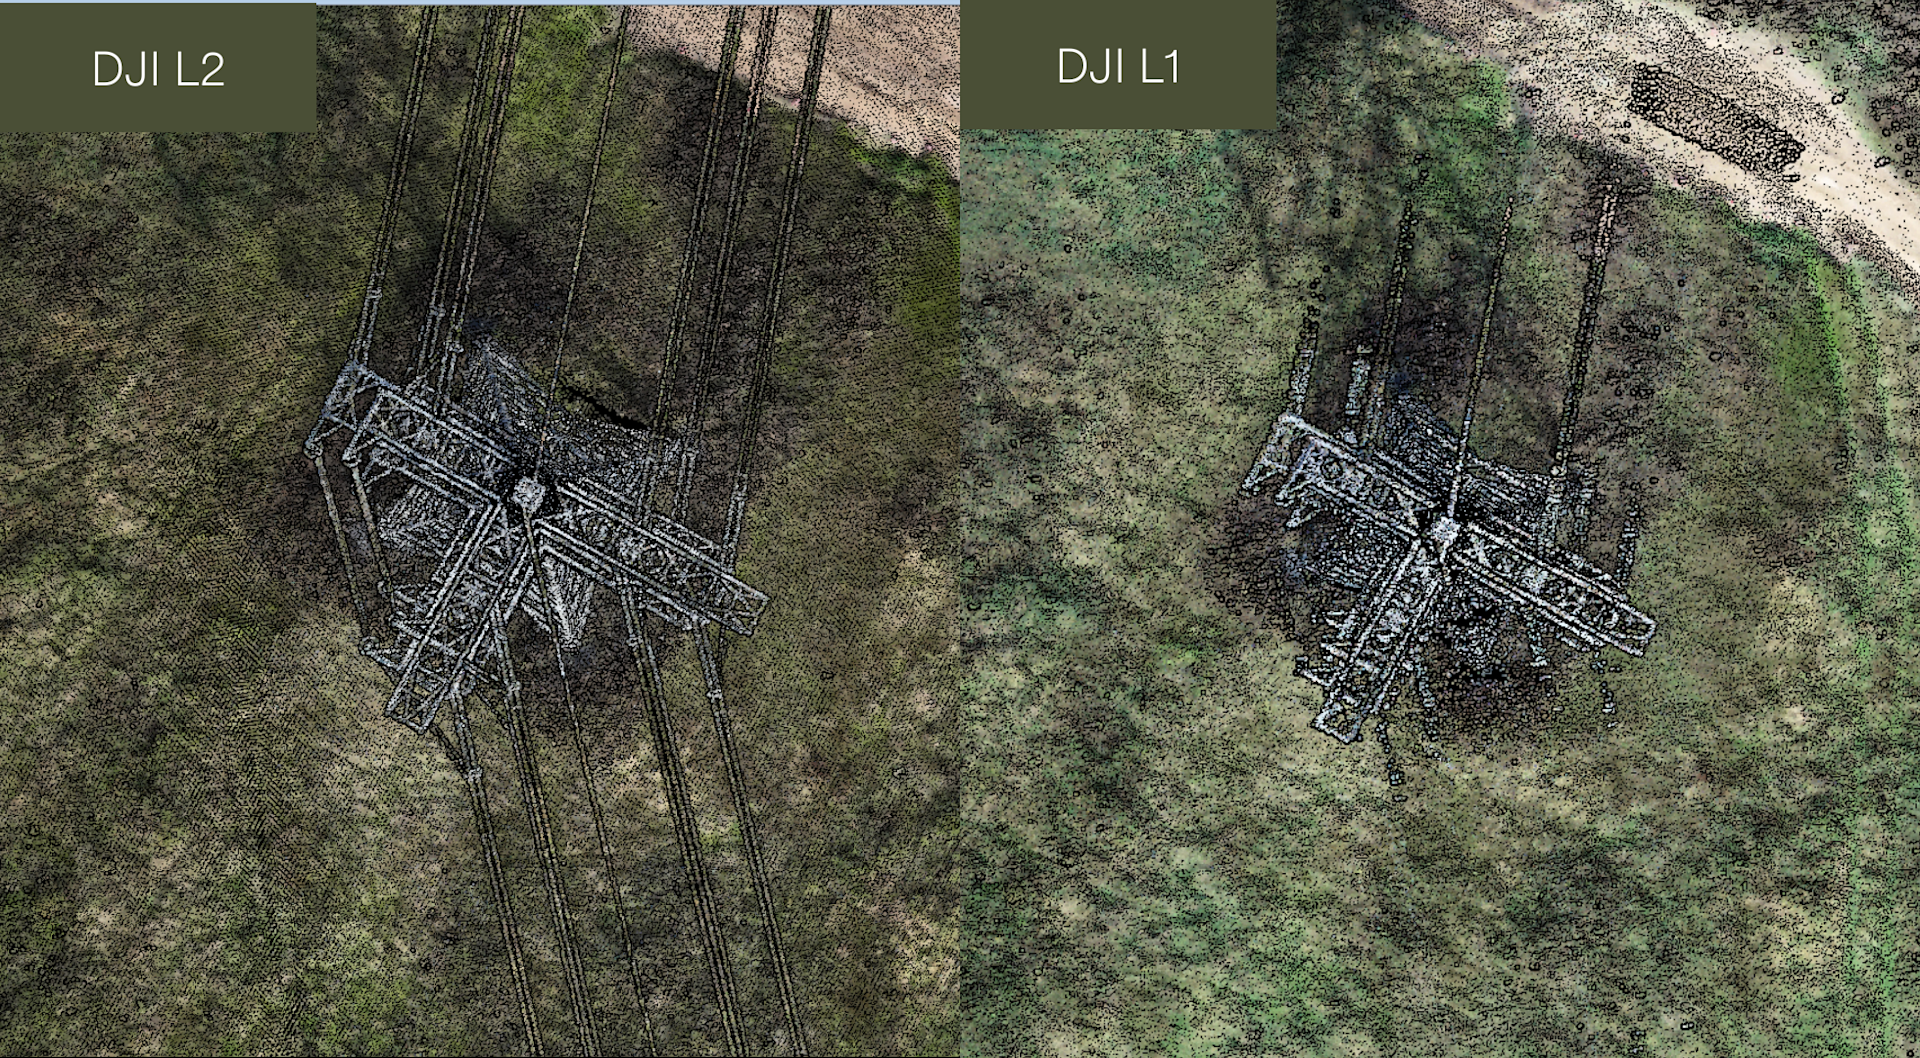
Terrasolid is a complementary software to DJI Terra. The initial data was processed in DJI Terra and then migrated to Terrasolid for further manipulation and analysis.
DTMs
LiDAR is often considered better for generating Digital Terrain Models (DTMs) compared to photogrammetry.
A key reason for this is that LiDAR can penetrate dense vegetation and capture the ground surface, even under thick canopies. In contrast, photogrammetry might struggle to capture the ground due to obstructing vegetation.
This is demonstrated in this graphic which shows the increased capabilities of LiDAR (pink) to penetrate the tree canopy compared to photogrammetry (blue).
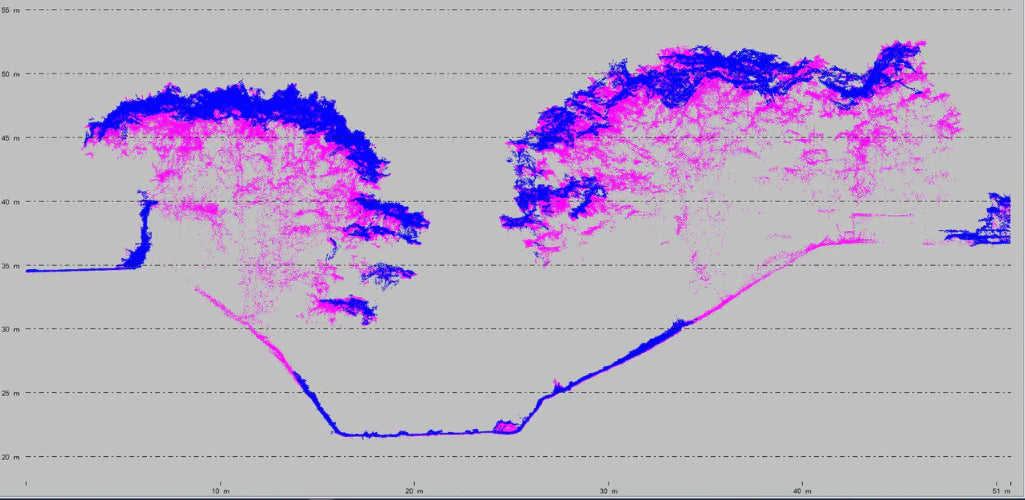
DTMs are the foundation of creating detailed and accurate topographic maps, providing essential elevation information and representing the Earth's natural surface accurately in 2D.
They benefit a range of use-cases, such as flood risk assessment, natural resource management, precision agriculture, environmental impact assessments, disaster management, and wildlife habitat modelling.
So, how do the L2 and L1 perform when it comes to creating DTMs?
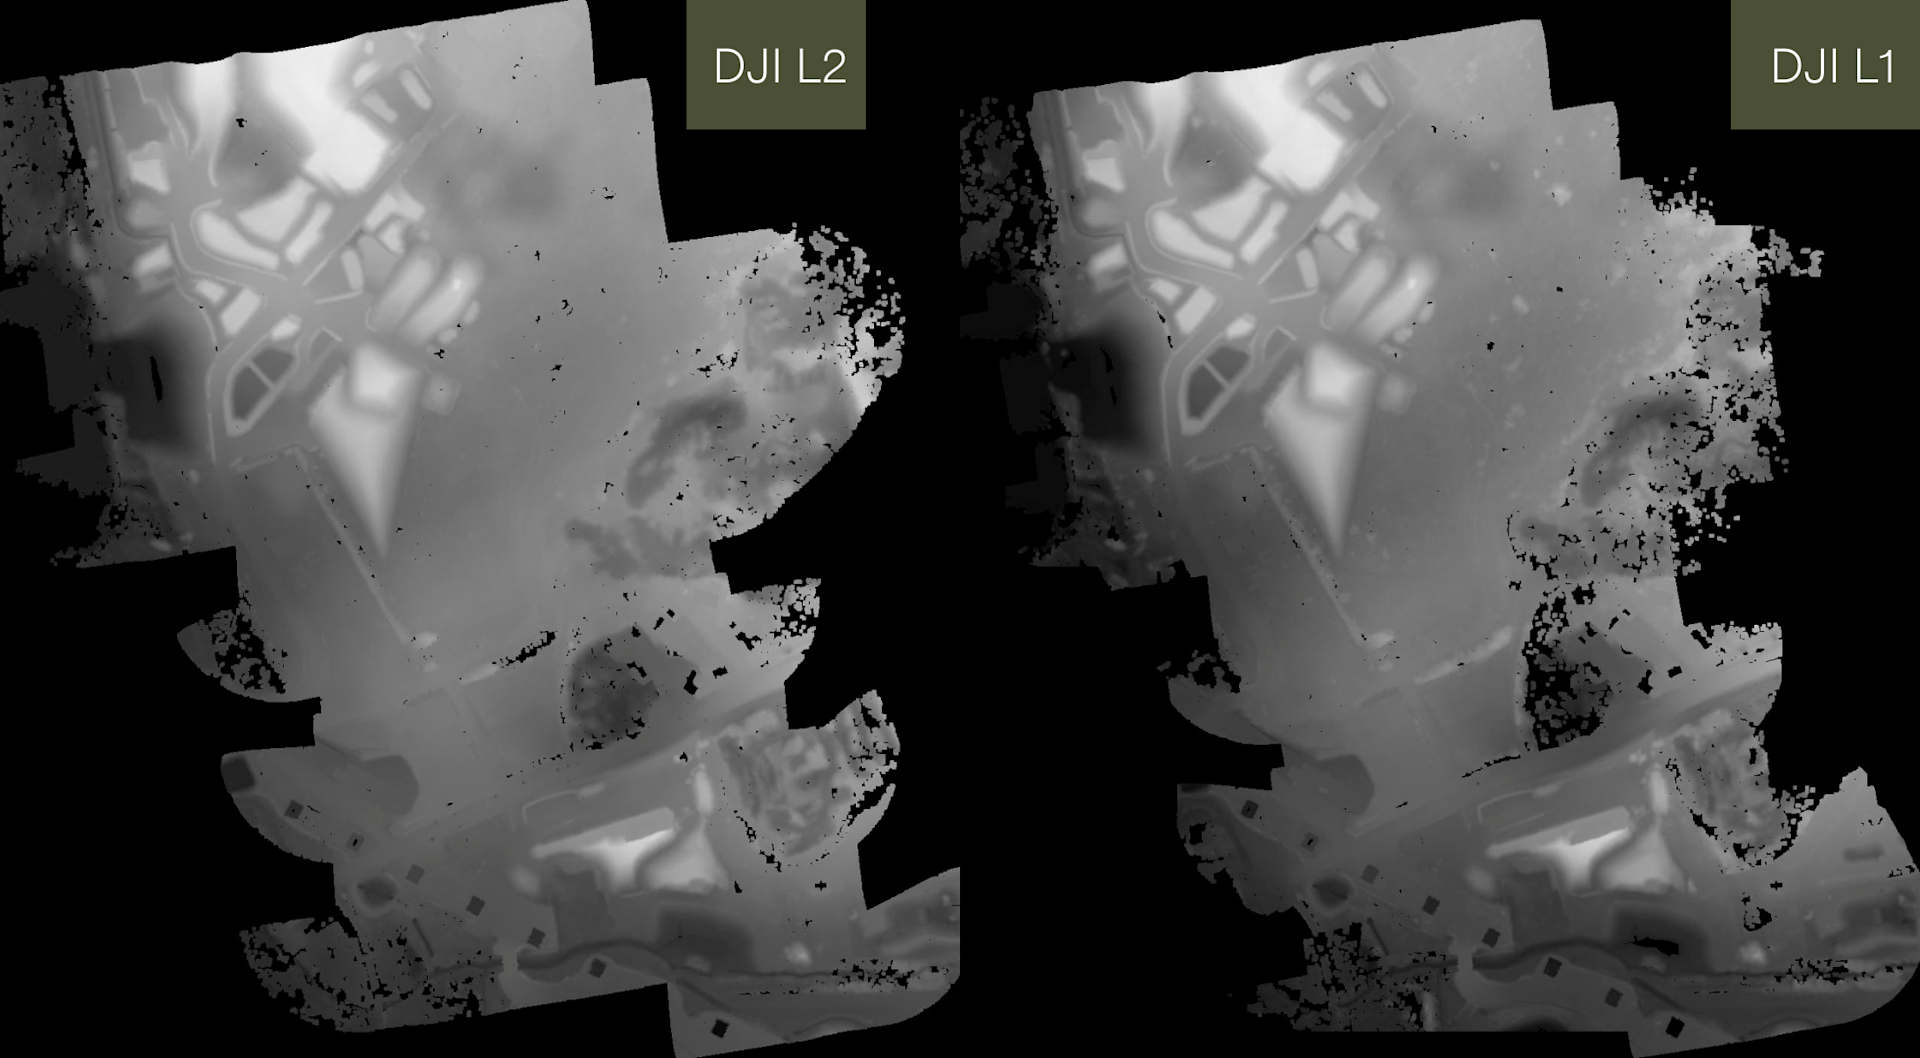
The graphic below, taken from the HS2 site, shows that the L2 created a more robust and complete ground surface, compared to the L1.
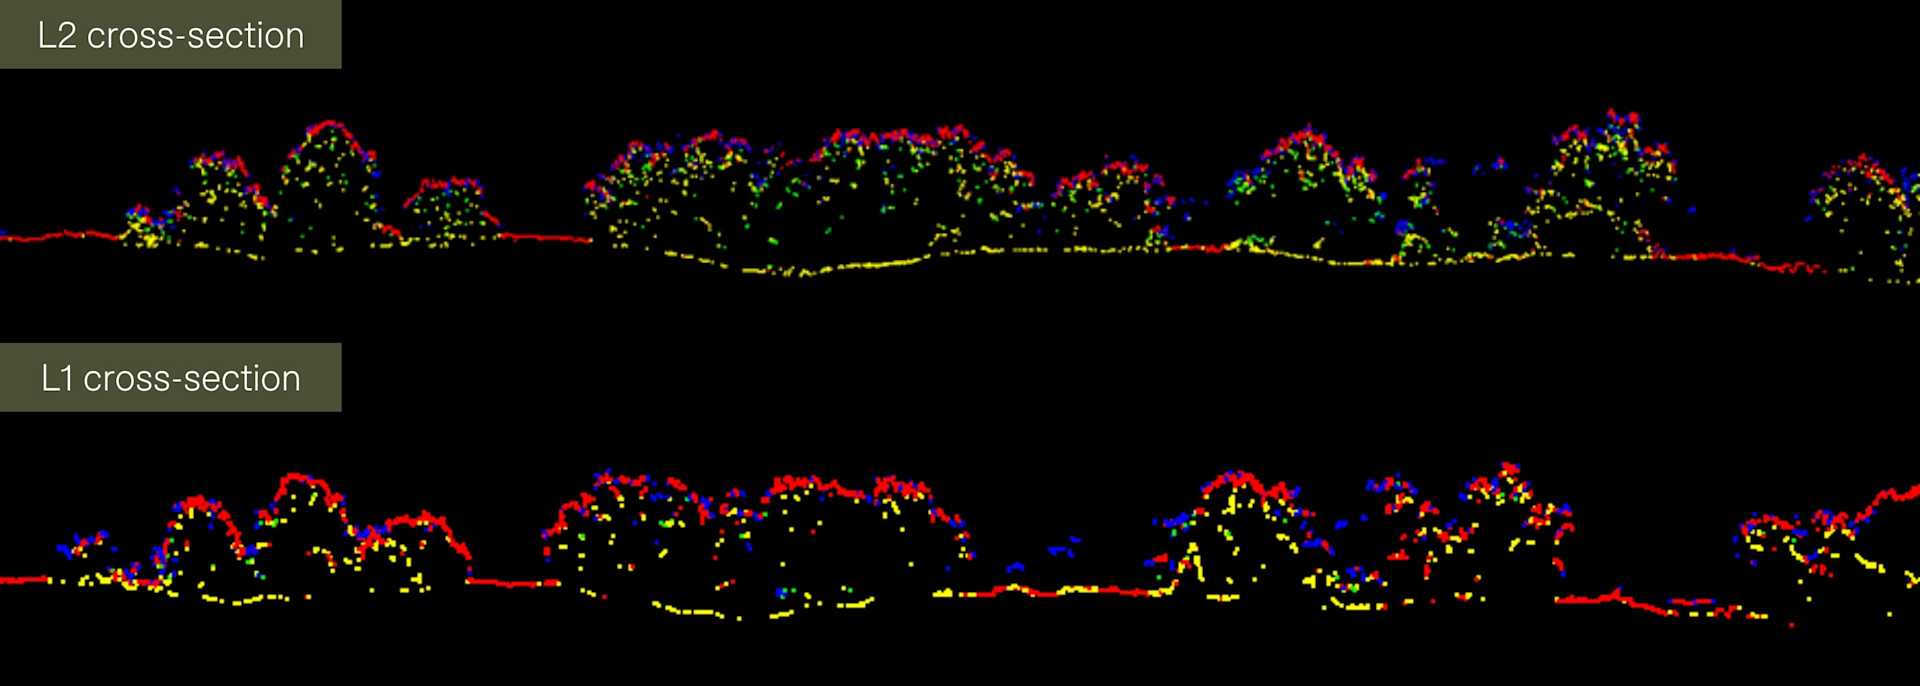
This enables the creation of a better quality DTM. This is because when the point cloud is rasterised to create the DTM there are fewer gaps in the data. The L2 DTM is far more complete with fewer areas where there is no data recorded to base the surface off.
This is aided by the L2's increased sampling rate and levels of return.
The vertical cross-sections above are displayed showing the return pulse data.
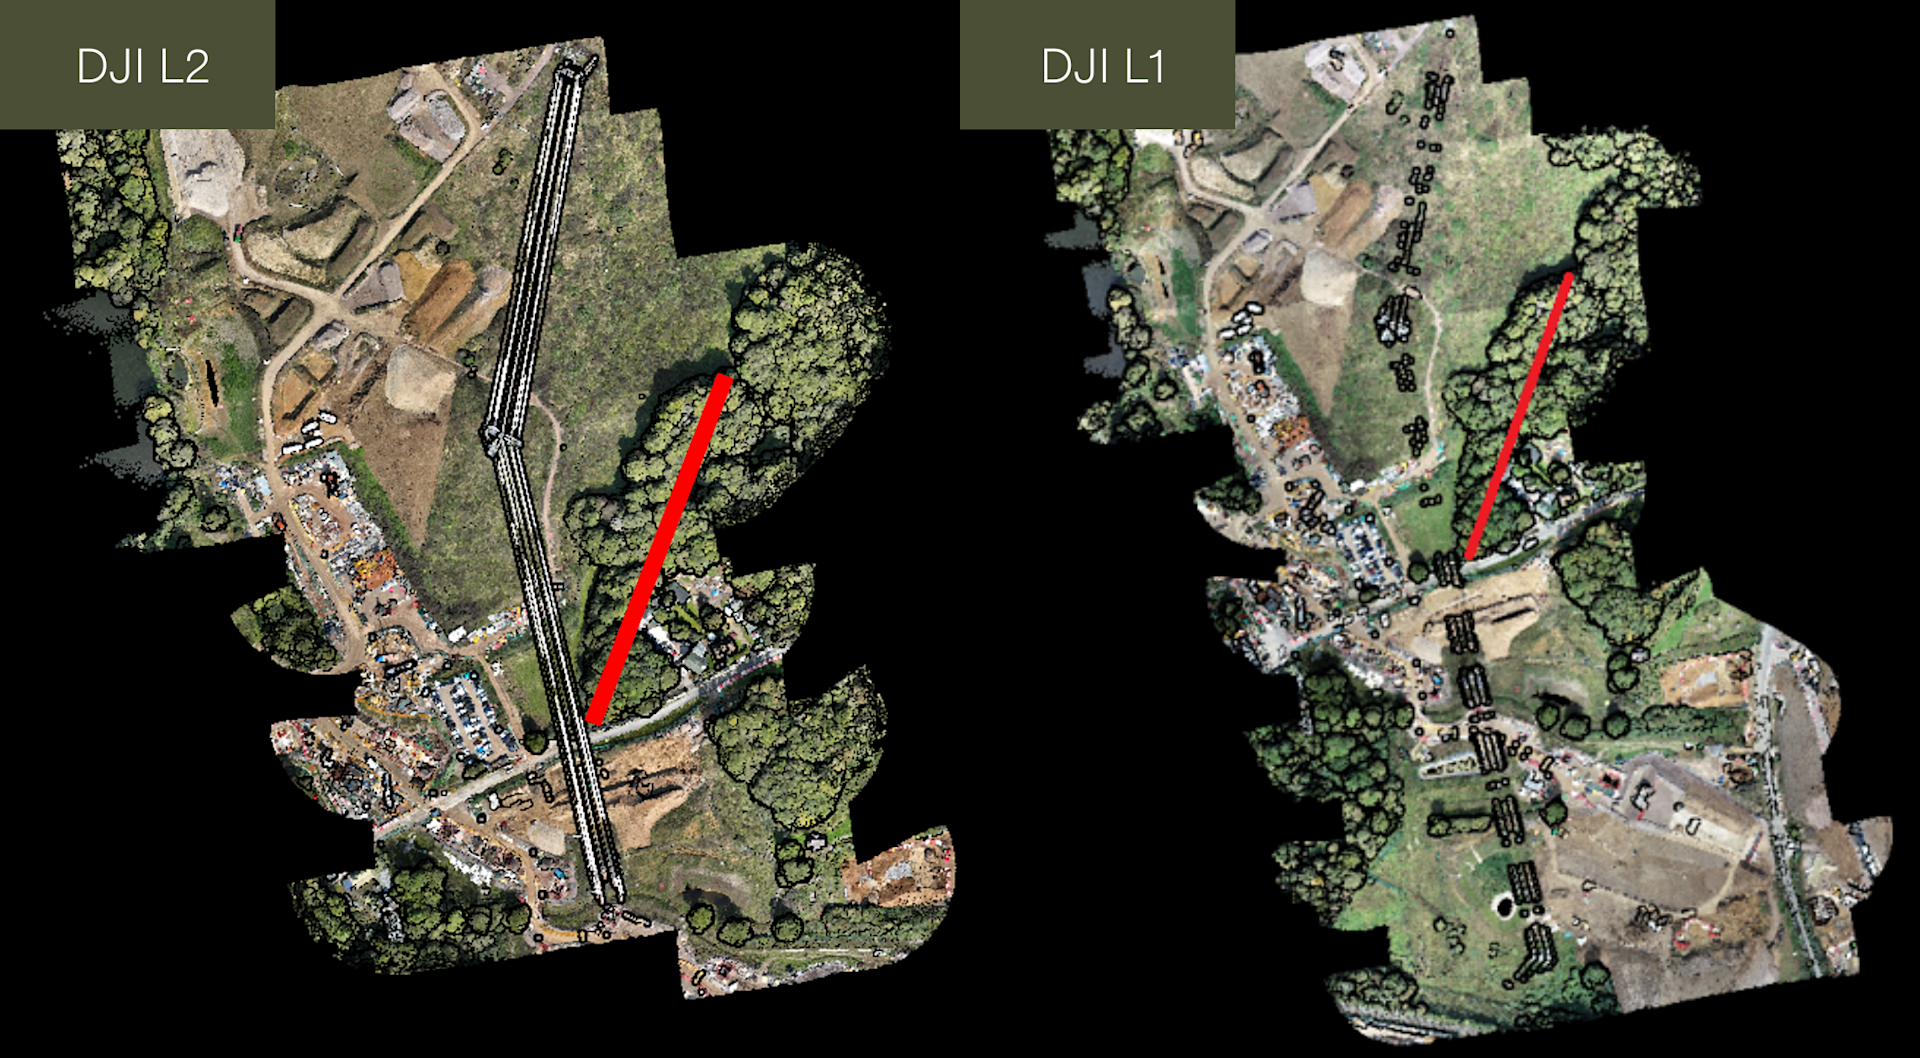
The images below show the flight path over the area of vegetation. As an aside, notice also how the powerlines are more complete in the L2 view, compared to the L1.
Impressed With The L2
After seeing the results, Pedro de Gouveia, Chief UAV Pilot at Murphy Geospatial, praised the capabilities of the L2.
He said: "I am very impressed with the quality of the point cloud and the density perspective that has come from the L2 versus the L1.
"It's definitely a big step over the previous sensor, so we are quite excited about it.
"As we have seen with the L2 data, the extra detail in finer features such as powerlines and more robust vegetation penetration yields better quality results.
"We are most interested in the increase in data quality over the L1 and the increased efficiency of use: One example being that the L2 does not need an IMU warm up before use."
Test Site Two: Komatsu (Smart Construction)
We conducted an accuracy test at our second site, at Komatsu UK (Smart Construction) - where heliguy™ held the UK's first official demonstration of the DJI Dock.
The purpose was to assess the vertical accuracy of both sensors, relative to some ground control.
The survey site is pictured below, using a 2D orthomosaic created with data captured by the L2's RGB camera.
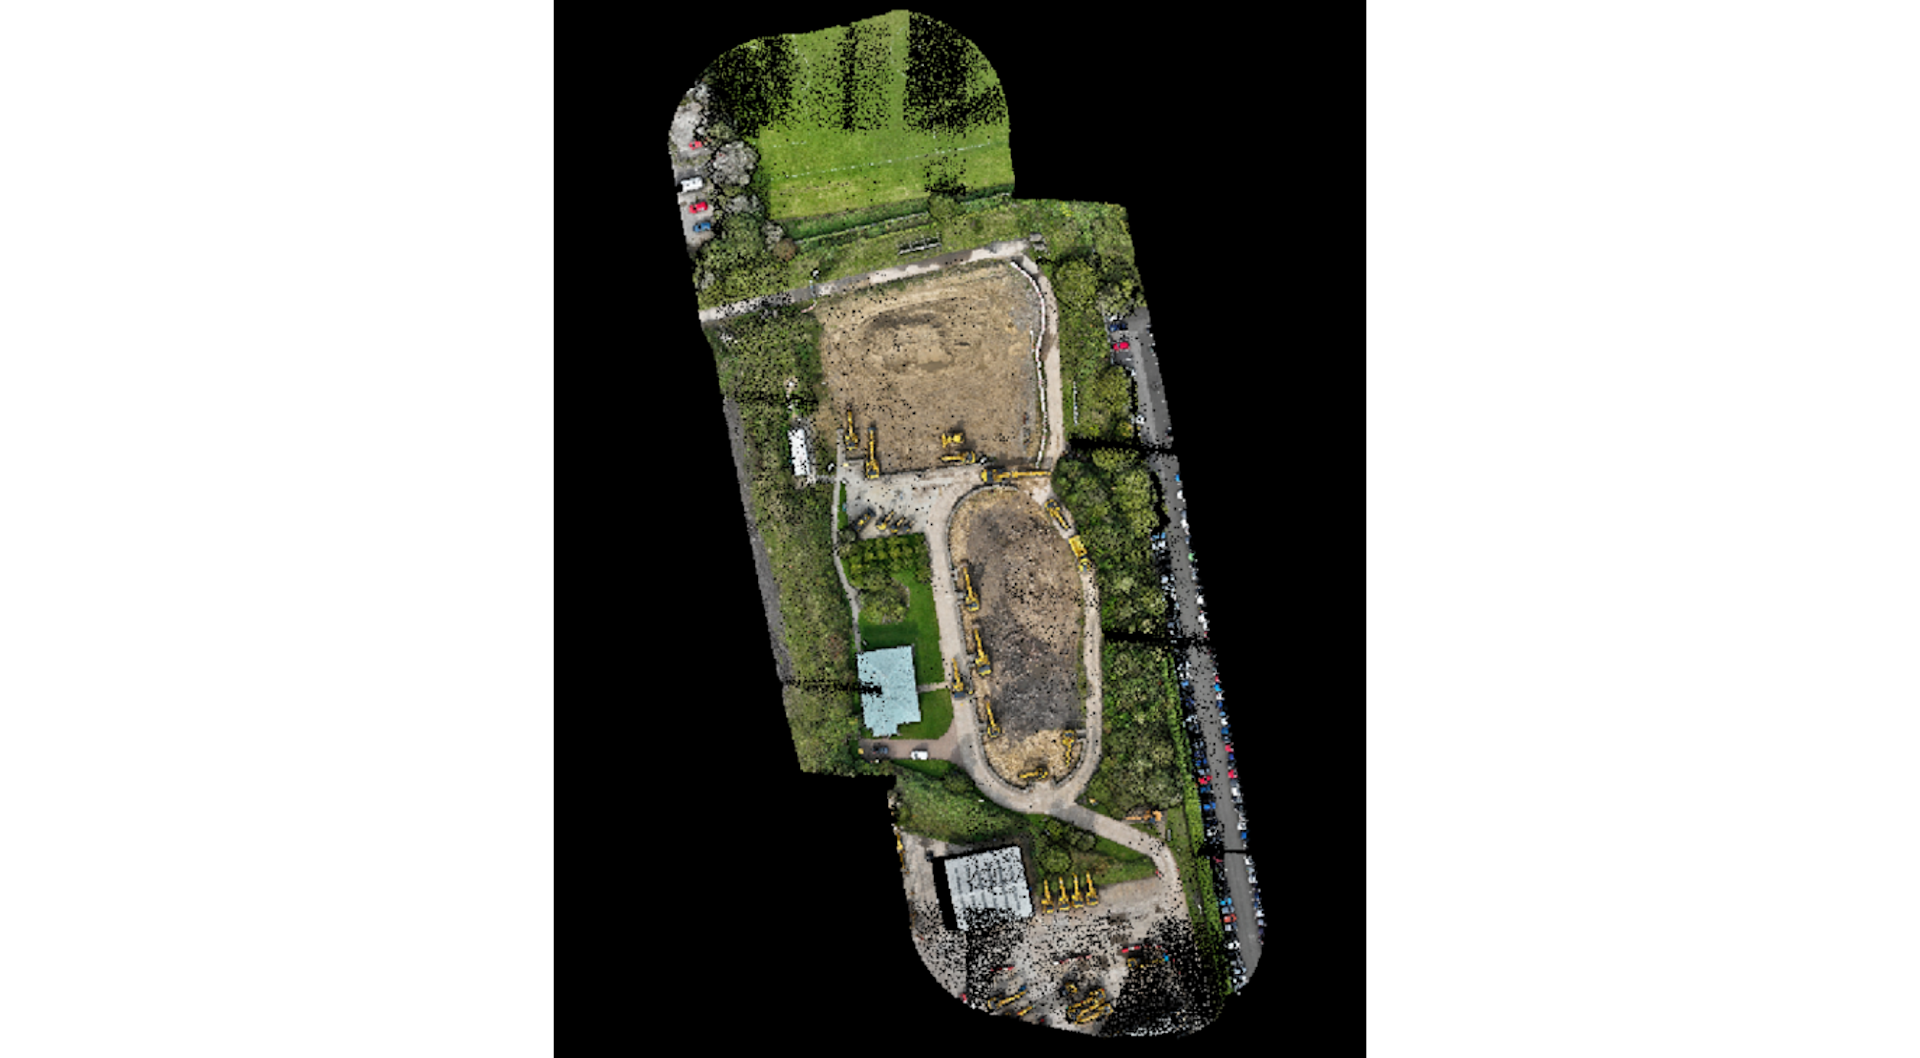
The flight was conducted at 50m flight altitude using network RTK.
The accuracy was compared against 11 checkpoints, located around the site, as shown by the image below.
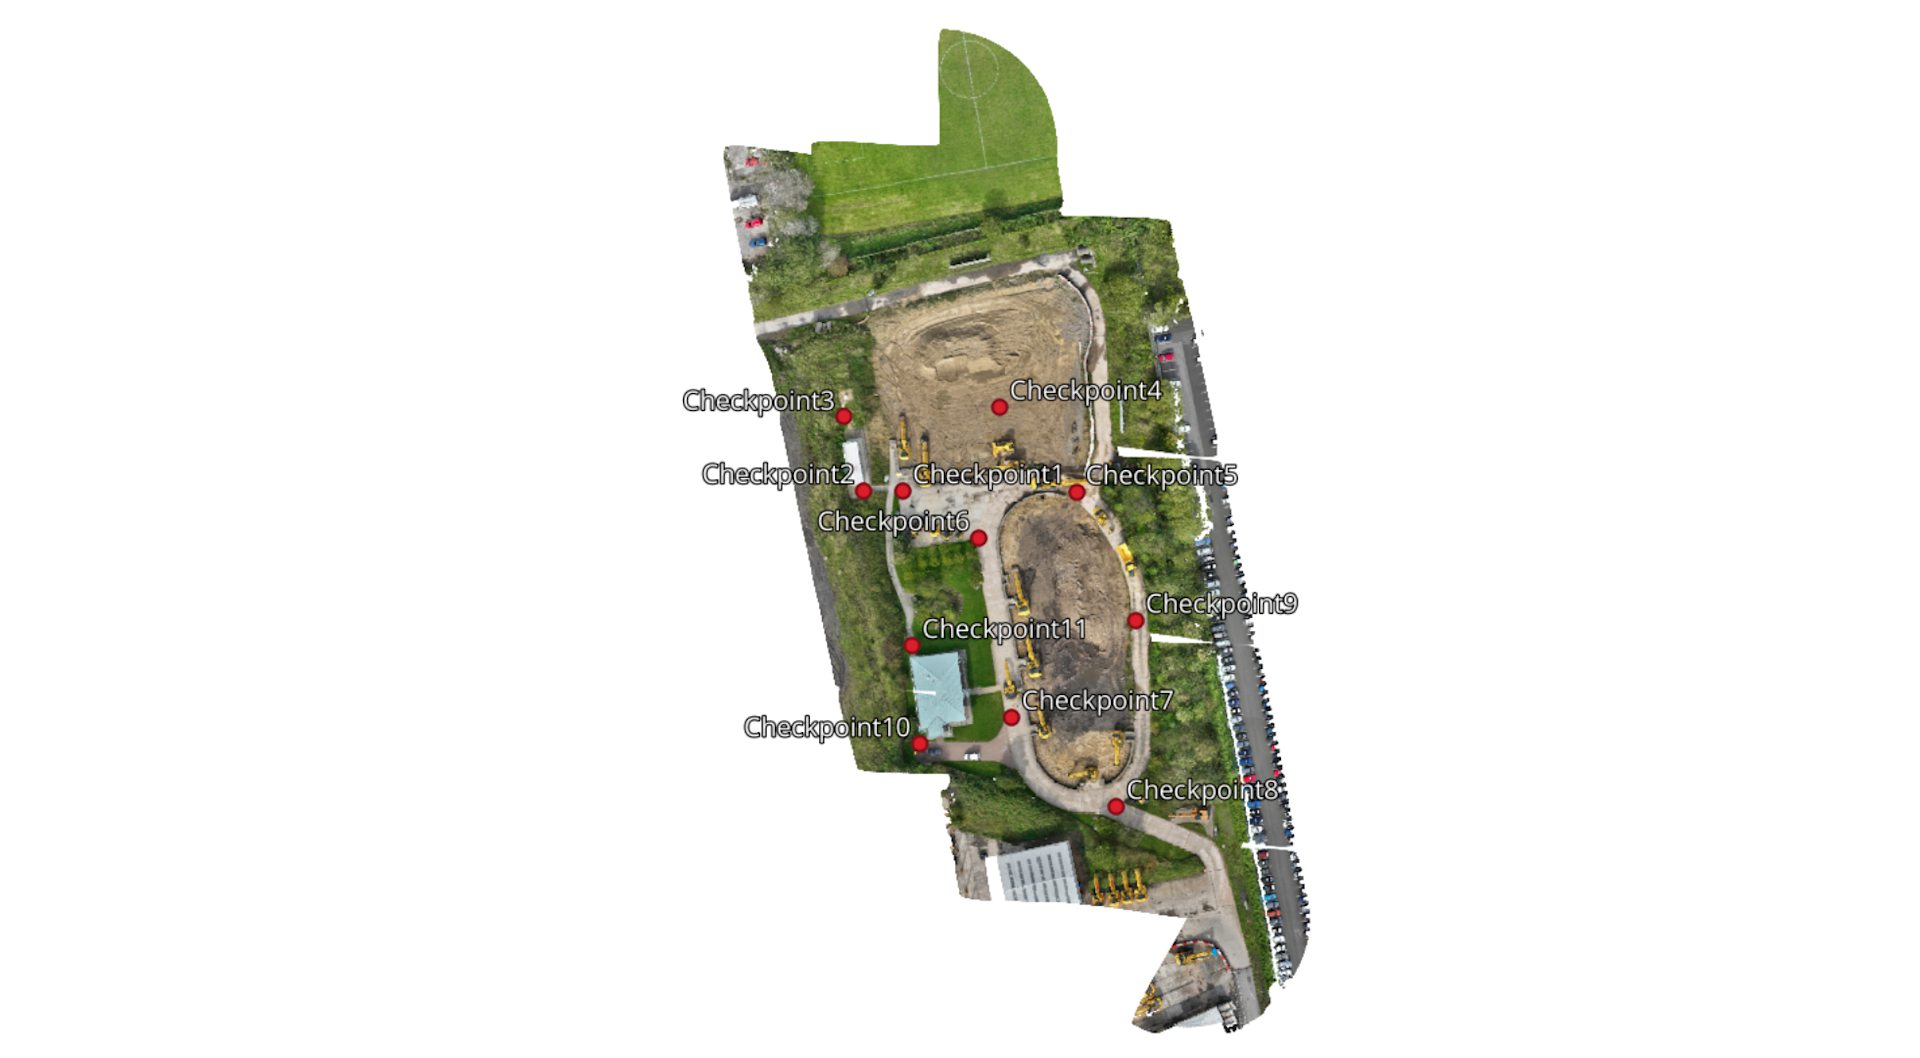
The data was captured with the Emlid RX using kinematic GNSS.
The checkpoints were collected relative to the British horizontal coordinate system OSGB36 British National Grid and the vertical coordinate system Ordnance Datum Newlyn.
The LiDAR data was transformed and compared to elevations using DJI Terra software.
The accuracy results are shown in the tables below.
L2 - Accuracy Table
lD | X/E | Y/N | Z/U | Reconstruction Altitude | Altitude Difference | Reflectivity | DEM Residual |
Checkpoint 1 | 426988.744 | 555507.879 | 29.574 | 29.510955 | -0.063045 | 44.176471 | -0.064533 |
Checkpoint 2 | 426977.154 | 555507.738 | 32.386 | 32.332125 | -0.053875 | 68 | -0.053776 |
Checkpoint 3 | 426971.714 | 555529.27 | 32.334 | 32.265565 | -0.068435 | 60.888889 | -0.064175 |
Checkpoint 4 | 427016.95 | 555532.088 | 29.268 | 29.248312 | -0.019688 | 31.076923 | -0.01939 |
Checkpoint 5 | 427039.261 | 555507.449 | 29.547 | 29.517893 | -0.029107 | 51 | -0.006884 |
Checkpoint 6 | 427010.67 | 555494.035 | 29.465 | 29.437909 | -0.027091 | 52.428571 | -0.032742 |
Checkpoint 7 | 427020.45 | 555441.956 | 29.419 | 29.390565 | -0.028435 | 47.05 | -0.03006 |
Checkpoint 8 | 427050.895 | 555415.93 | 29.422 | 29.386423 | -0.035577 | 50.571429 | -0.042391 |
Checkpoint 9 | 427056.486 | 555470.066 | 31.769 | 31.736009 | -0.032991 | 38.363636 | -0.052366 |
Checkpoint 10 | 426993.7 | 555434.146 | 31.321 | 31.263169 | -0.057831 | 33 | -0.057875 |
Checkpoint 11 | 426991.519 | 555462.74 | 31.103 | 31.032755 | -0.070245 | 42.333333 | -0.086014 |
L1 - Accuracy Table
ID | X/E | Y/N | Z/U | Reconstruction Altitude | Altitude Difference | Reflectivity | DEM Residual |
Checkpoint 1 | 426988.744 | 555507.879 | 29.574 | 29.613559 | 0.039559 | 40.875 | 0.037683 |
Checkpoint 2 | 426977.154 | 555507.738 | 32.386 | 32.433613 | 0.047613 | 57 | 0.044113 |
Checkpoint 3 | 426971.714 | 555529.27 | 32.334 | 32.38752 | 0.05352 | 59 | 0.052116 |
Checkpoint 4 | 427016.95 | 555532.088 | 29.268 | 29.33932 | 0.07132 | 29.477273 | 0.068321 |
Checkpoint 5 | 427039.261 | 555507.449 | 29.547 | 29.594818 | 0.047818 | 35 | 0.060699 |
Checkpoint 6 | 427010.67 | 555494.035 | 29.465 | 29.511275 | 0.046275 | 38.217391 | 0.040709 |
Checkpoint 7 | 427020.45 | 555441.956 | 29.419 | 29.464285 | 0.045285 | 28.833333 | 0.041271 |
Checkpoint 8 | 427050.895 | 555415.93 | 29.422 | 29.476193 | 0.054193 | 39.859155 | 0.053391 |
Checkpoint 9 | 427056.486 | 555470.066 | 31.769 | 31.81791 | 0.04891 | 32.4 | 0.038929 |
Checkpoint 10 | 426993.7 | 555434.146 | 31.321 | 31.367136 | 0.046136 | 16.823529 | 0.038454 |
Checkpoint 11 | 426991.519 | 555462.74 | 31.103 | 31.173319 | 0.070319 | 20.615385 | 0.077148 |
To obtain our absolute vertical error, we added the Altitude Difference fields and divided them by 11.
Using the output from DJI Terra, this gave an absolute vertical error of 0.044 (44mm) for the L2, and 0.051 (51mm) for the L1.
This particular survey did not use black and white control markers which would be visible to LiDAR data. To assess XY planimetric accuracy, signal markers can be imported into Terrasolid software for comparison.
Accuracy was the main test at the Komatsu site. But it is also worth looking at the difference between the resulting RGB point cloud views between the two.
Once again, the L2 created a more robust colourised point cloud.
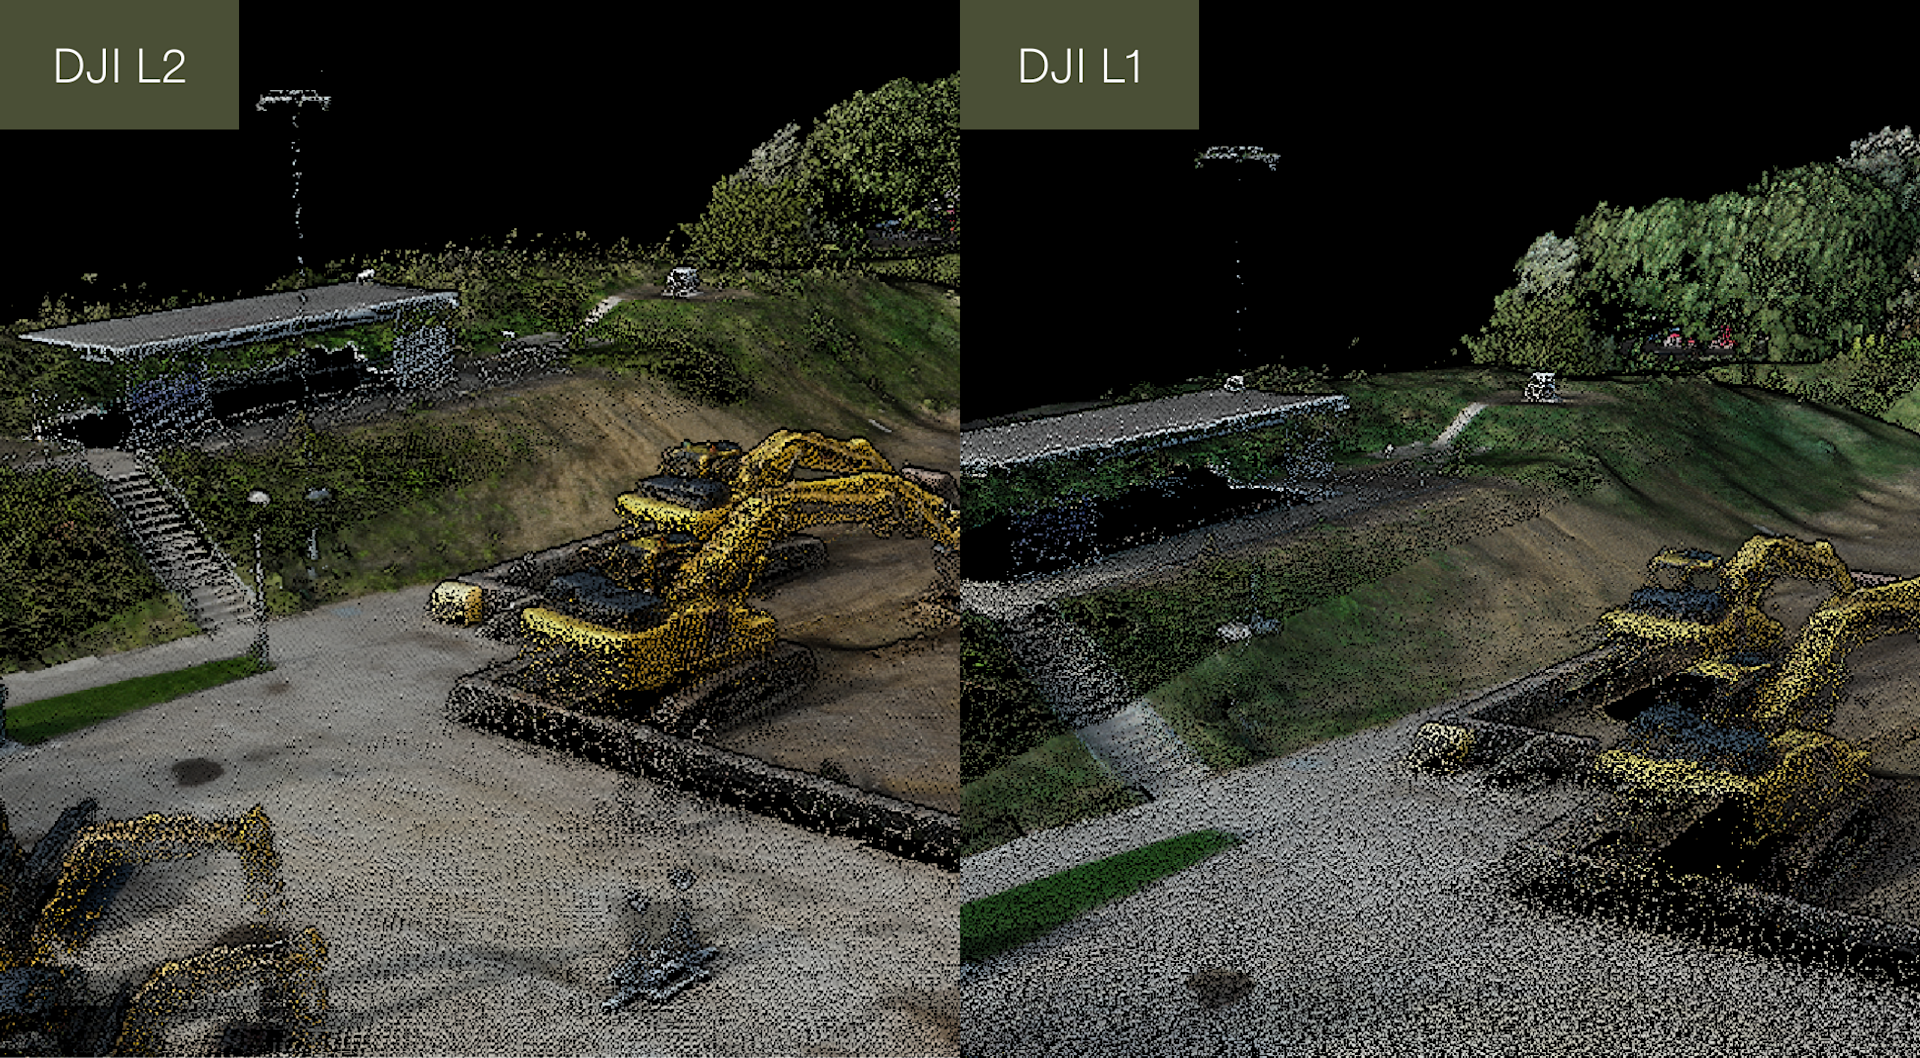
For instance, in the L2 graphic:
The steps are more defined;
The floodlight to the centre of the picture is more robust;
A light column to the left of the picture is present. This column is missing in the L1 dataset;
The wall is more complete, and texture is added to the top of the wall;
The diggers are more complete and feature extra detail.
DJI Zenmuse L2 vs DJI Zenmuse L1: DJI Pilot And DJI Terra
There are some differences in functionality in DJI Terra and the DJI Pilot app when using the L2 and L1.
These are set out in the table below.
DJI Pilot App
L2 | L1 | |
Spilt Screen Display | Supports three real-time display modes: Visible light; Point cloud; Point cloud/visible light split screen | Supports three real-time display modes: Visible light; Point cloud; Point cloud/visible light split screen |
Point Cloud Mapping Playback | Support | Not Support |
Multi-flight Point Cloud 3D Model Stitching | Support | Not Support |
2D Map Point Cloud | Support | Not Support |
Field Quality Report | Support | Not Support |
The L2 supports quick acquisition and viewing of point cloud quality and thinning model results through the remote control in the field.
This enables operators to keep abreast of the data collection status and improve overall operational efficiency.
DJI Terra
L2 | L1 | |
Point Cloud Generation With One Click | Free Support | Not Support |
Ground Point Classification | Free Support | Support |
DEM One-click Generation | Free Support | Support |
Point Cloud Profile Analysis | Free Support | Support |
Point Cloud Quality Analysis Report | Free Support | Support |
The L2 includes a DJI Terra licence for point cloud data processing, including pre-processing and post-processing point cloud functions.
DJI says that during the product life-cycle, new point cloud functions will be free of charge.
In contrast, advanced processing functions in Terra with L1 data is only supported in paid-for licences.
Summary
Released in 2020, the L1 was a ground-breaking sensor: Offering a plug and play LiDAR and photogrammetry solution at an affordable price.
Now, the L2 is here and offers some significant advancements which will enhance surveying accuracy, efficiency, and point-cloud generation.
To add the L2 to your workflows, contact us.
