
Technical
Stockpile Surveys with GeoSLAM Mobile LiDAR
GeoSLAM mobile LiDAR scanners streamline stockpile surveys - vital for applications such as AEC and mining. The automated workflow, including go-anywhere mapping sensors and the GeoSLAM Volumes software, helps firms track stockpile inventor ... Read More

The GeoSLAM ecosystem streamlines stockpile surveys: Vital for applications such as AEC and mining;
Rapid data collection: Case study shows how GeoSLAM ZEB Horizon surveyed a stockpile in 10 minutes, compared to an hour using a GPS rover. The data was also more dense and accurate;
GeoSLAM's handheld mobile LiDAR scanners do not require GPS - useful for underground or indoor mapping - and can be drone-mounted for aerial data collection;
Anaylse stockpiles and generate company-branded reports through GeoSLAM Volumes software, which also automatically removes structures around the stockpile survey area to streamline this stage of data processing;
The automated, real-time workflow - including minimal desk processing - helps firms track volumetric stockpile data for enhanced site operations and supply-chain management;
British Gypsum says GeoSLAM sensors 'completely revolutionise stockpile surveying'.
Stockpile management is an essential requirement on any jobsite - and the GeoSLAM LiDAR ecosystem features a powerful suite of tools to streamline and automate data collection and analysis.
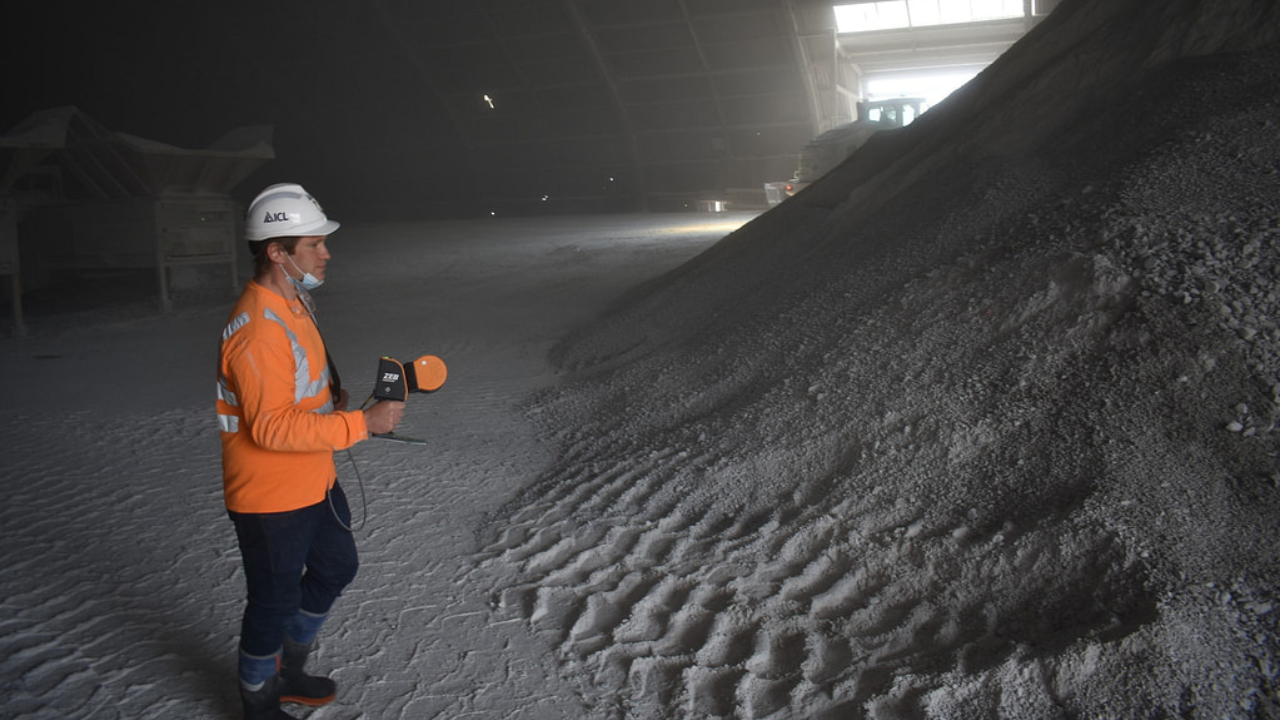
GeoSLAM's handheld go-anywhere laser scanners benefit rapid data collection and do not require GPS, meaning that stockpile information can be gathered from a variety of locations, such as underground (useful for mining) or indoors. The ZEB Horizon can also be drone-mounted to further improve scan efficiency.
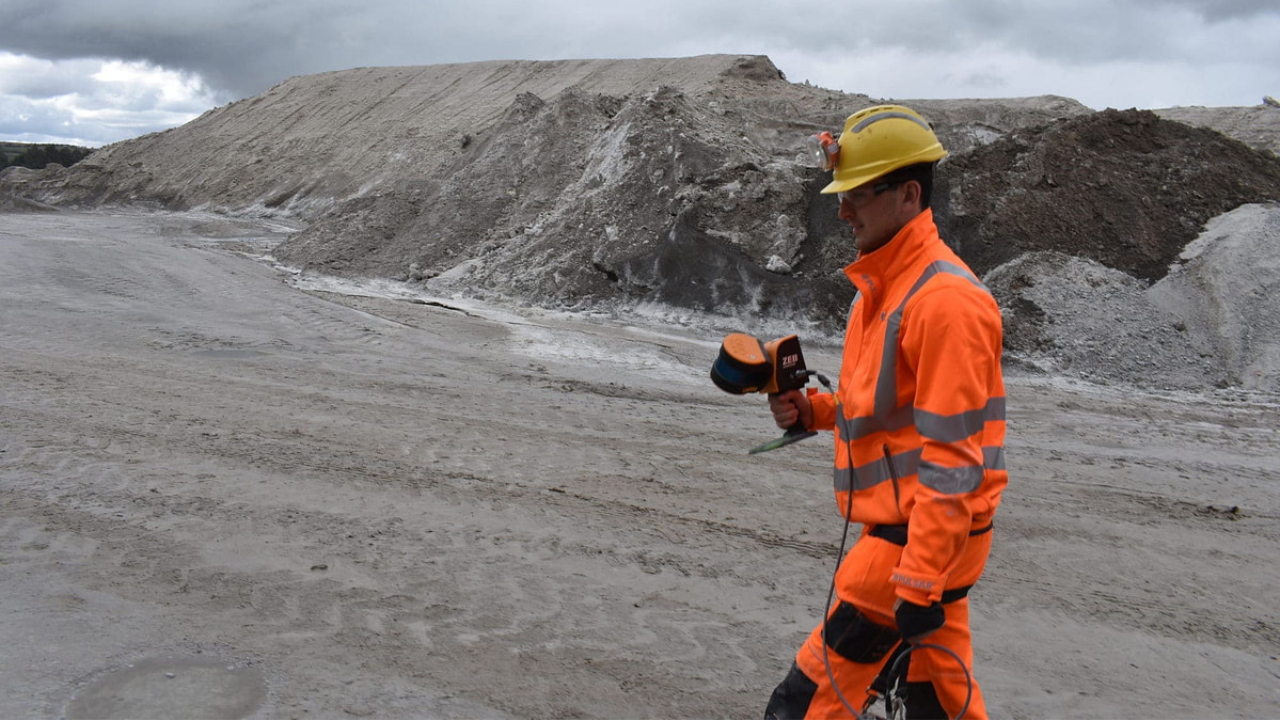
One case study with British Gypsum shows how the GeoSLAM ZEB Horizon completed a stockpile survey in 10 minutes, compared to an hour using a GPS rover, and the data was more dense and accurate.
Easy-to-use, the GeoSLAM sensors (which utilise SLAM technology to build a map and provide locational data simultaneously) enable highly-accurate and repeatable monitoring to enhance site management: Monitor and manage stockpiles; track stockpile inventory and volume change; and confidently verify volumes at all stages of the supply chain, as often as necessary.
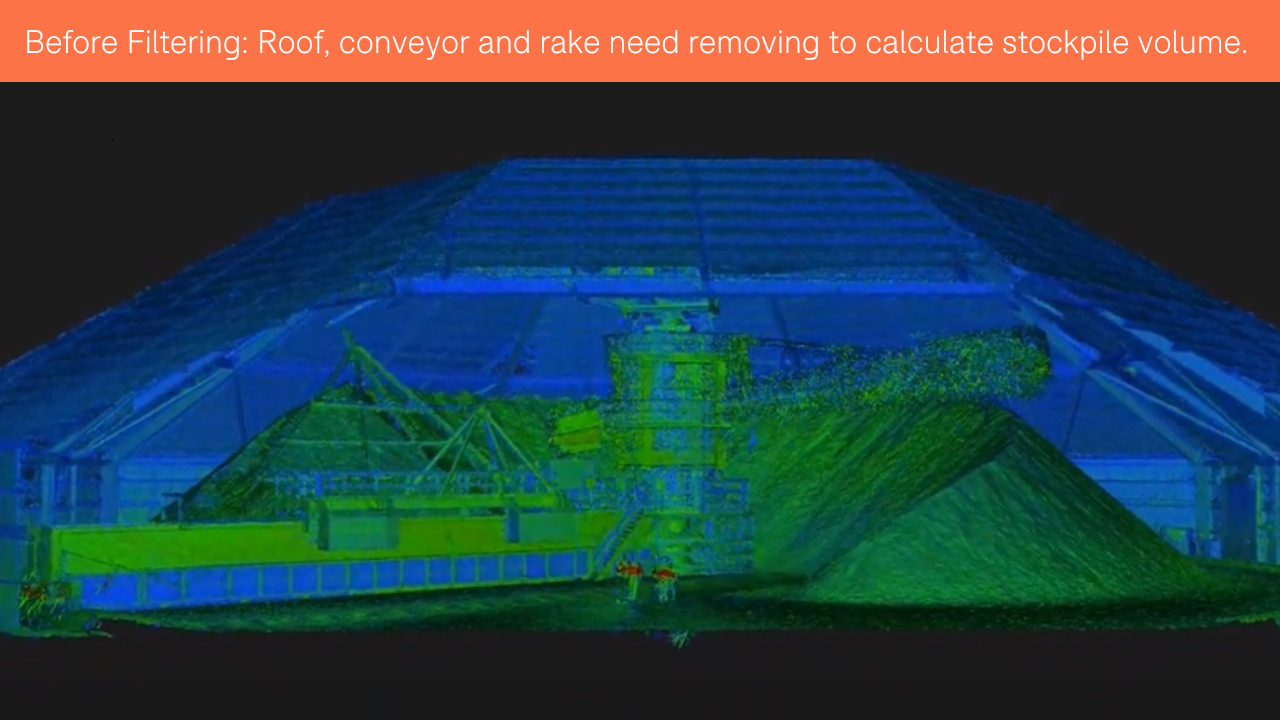
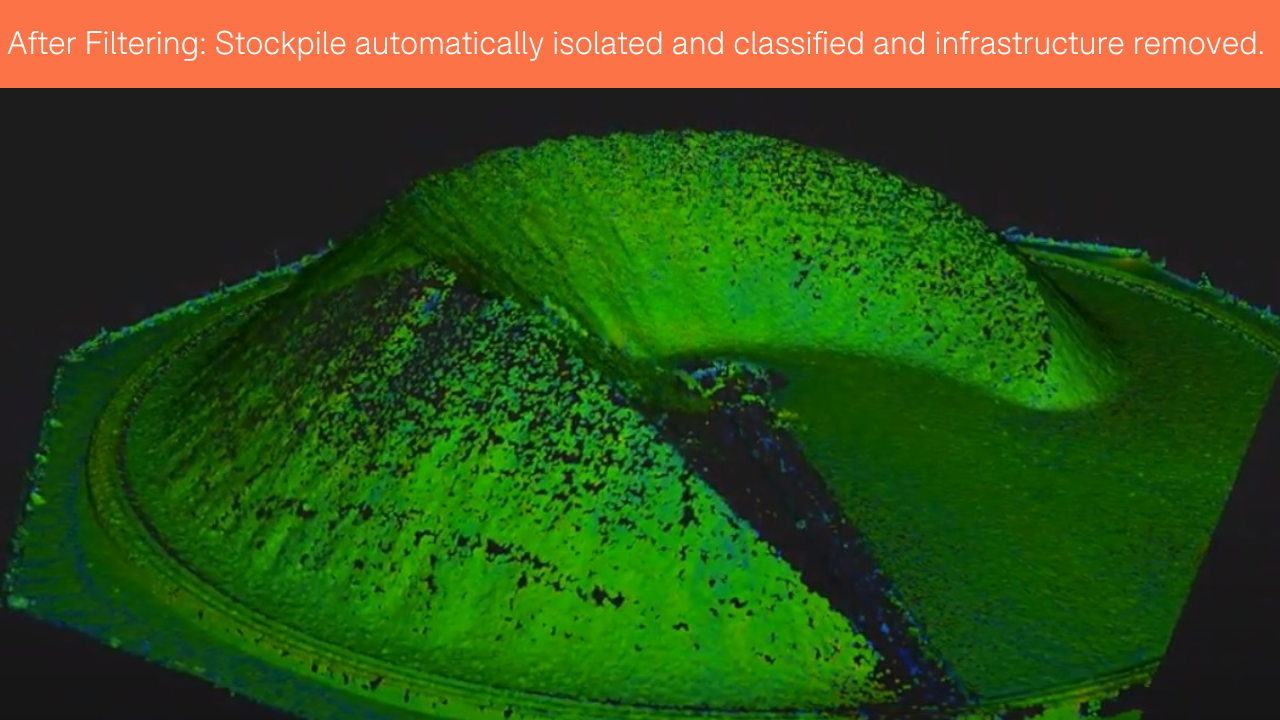
Upload the data into the GeoSLAM Volumes software which automatically isolates the stockpile in a scan and removes unwanted structures. This filtering process automates this key stage of stockpile surveys, removing the need for users to manually crop the data.
Use GeoSLAM Volumes to conduct analysis of detailed 3D models; view results in a tabular format; set alarms when your stockpile reaches min/max tonnage, volume or height; centralise data; and generate and share company-branded stockpile measurement reports.

These real-time insights enable stakeholders to make informed decisions on stockpile assets and share this information team-wide, to strengthen operations, manage supply chains, reduce inefficiencies, limit downtime and increase ROI.
heliguy™ has added the GeoSLAM products to its land and drone surveying ecosystem. Benefit from workflow support from the heliguy™ in-house surveying team. With almost 20 years of experience in the drone industry, heliguy™ is particularly well placed to support GeoSLAM UAV mapping, including in-house drone training and drone repair centre for lifetime support.
This blog explores the benefits of using GeoSLAM's mobile laser scanners for stockpile management and how GeoSLAM's automated data collection and processing workflow can streamline the process.
Mobile Laser Scanning For Stockpile Management
Numerous solutions are available for stockpile monitoring, such as photogrammetry, GPS and terrestrial laser scanning systems.
But as the table below shows, mobile laser scanning - such as GeoSLAM's sensors - has some distinct advantages, including the speed and efficiency of data capture.
Method | Pros | Cons |
Photogrammetry | • Fast to collect • Easy to access hardware and software | • Reliable on environmental factors • Restricted airspace • Variations on accuracy • Desk processing time |
GPS | • Accurate single measurements • Kit regularly accessible on most sites • 'Traditional' | • Single point measurement • Time consuming • Needs surveyor input • Desk processing time |
Terrestrial Laser Scanning | • Accurate • Point cloud generation (best for volumes) • Possible fast surveys | • Expensive • Requires set ups • Full coverage can be difficult • Desk processing time |
Mobile Laser Scanning (GeoSLAM) | • Accurate • Point cloud generation (best for volumes) • Fast surveys • Autonomous processing • Automated reporting | • Initial project setup time |
Case Study: GeoSLAM LiDAR Vs GPS Rover For Stockpile Survey And Volume Calculations
The table above highlights the value of mobile laser scanning for stockpile analysis. An on-site field test, conducted by construction engineering company, British Gypsum, comparing the GeoSLAM ZEB Horizon and a GPS rover, proves this point.
GPS rover has become a staple for stockpile measurements, helping to accurately map the stockpile with one instrument. However, the drawback is that the surveyor has to physically take every measurement required to map the stockpile which can be very time consuming and lack accuracy.
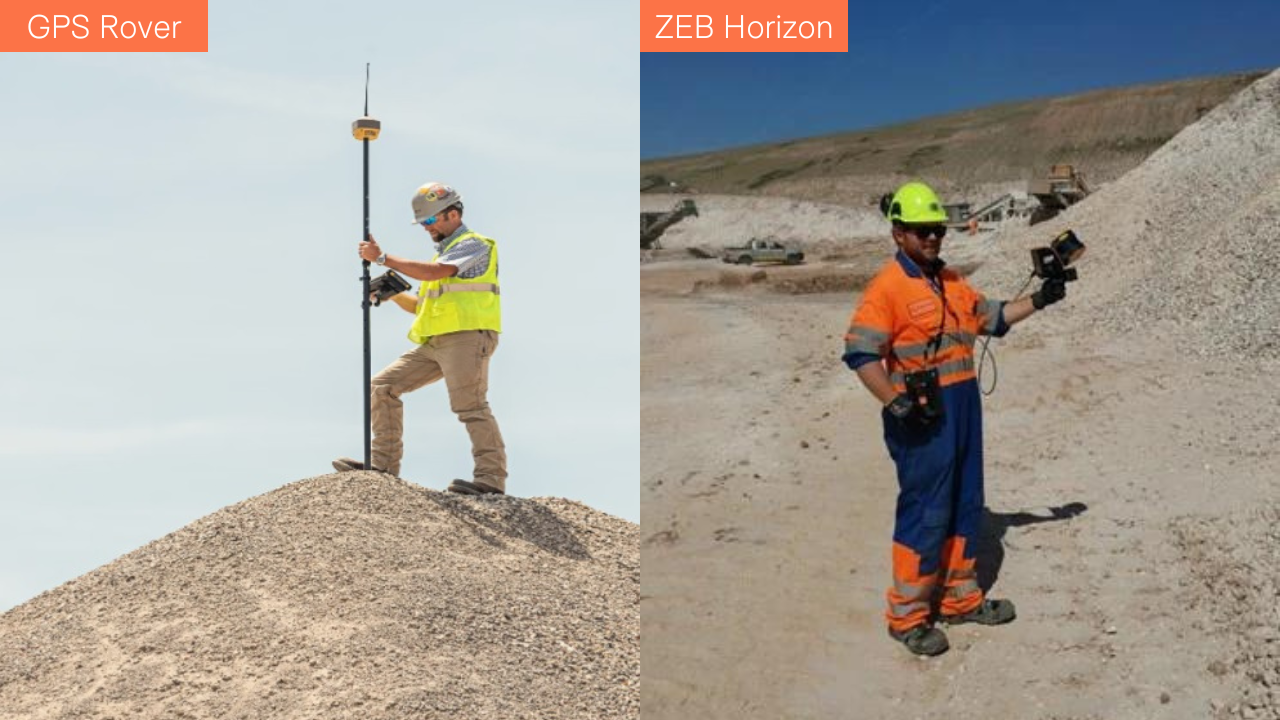
However, GeoSLAM’s ZEB Horizon solves some of the problems associated with the traditional GPS method, such as:
300,000 points per second and 100m range to increase speed and efficiency;
Up to 1cm accuracy;
Real-time survey while on the move, benefiting from SLAM technology;
Produces point clouds in various export formats with the function of reducing the number of points in the survey by a percentage to reduce the file size and processing times;
Can be drone-mounted.
For the field test, a quarry stock survey was completed on-site with both instruments on the same morning.
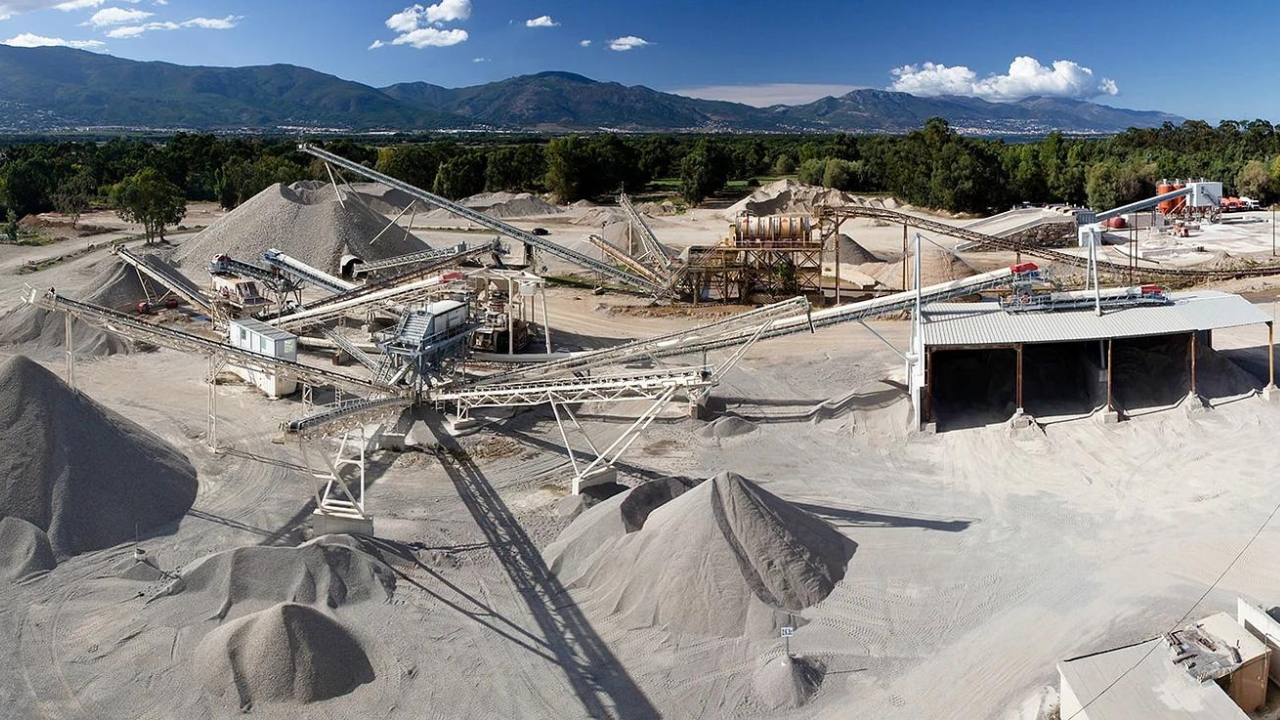
These were the key results:
GPS | ZEB Horizon | |
Survey Time | 1 hour | 10 minutes |
Processing Time | 15 minute | 1 hour |
Volume Calculated | 19,014m³ | 18,848m³ |
Guy Kantorowich, from British Gypsum, who conducted the survey, said: "There is quite a stark difference between the two methods especially when you look at the time spent on site carrying out the survey. The longer processing time is a small price to pay when you can reduce your survey time significantly. The less time the surveyor spends on-site in a potentially hazardous area the better."
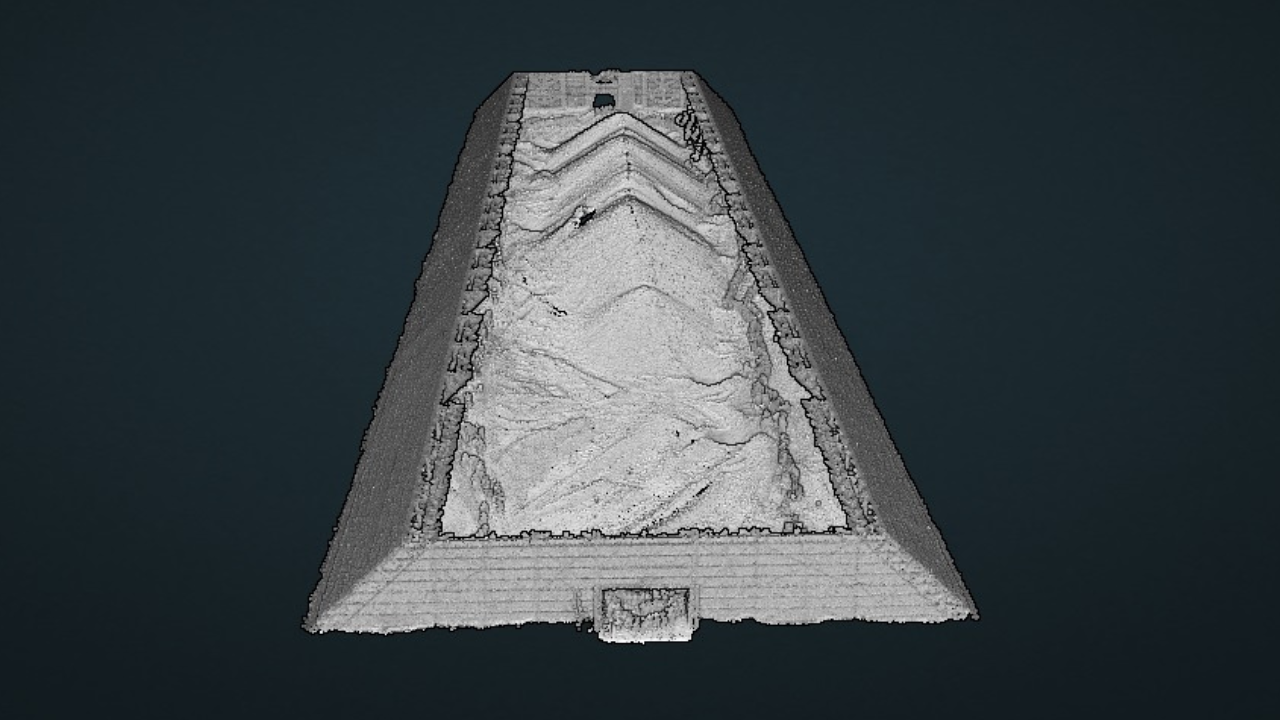
And these were the 3D models generated from the surveys. The model from the ZEB Horizon is on the right.

Guy said: "There is a difference in the volume calculated, but at only 166m³ this is negligible, especially when you look at the models and level of detail in each of the surveys.
"This difference is almost certainly due to the ZEB Horizon survey being more detailed and thus more accurate. A smaller sampling strategy adopted by the traditional GPS method means most of the data needs to be interpolated, whereas the ZEB Horizon allows for a more even sampling rate to better represent the whole stockpile rather than assume data."

The ZEB Horizon also has the potential to be vehicle or UAV mounted. This would further reduce the risk to the surveyor.
In conclusion, Guy said: "GeoSLAM technology has the capabilities to completely revolutionise the surveying of stockpiles.
"Internal stockpiles are surveyed with even greater ease when compared to a one-man total station, with no more multiple set-ups and complex resections.
"As a surveyor who has spent many years clambering over stockpiles and getting increasingly frustrated at the complex, uneven, messy nature of them, the ZEB Horizon is a breath of fresh air."
GeoSLAM Stockpile Workflow
The GeoSLAM ecosystem provides an automated end-to-end workflow for stockpile management, including superfast capture time and minimal desk processing.
For instance, this stockpile was captured in 20 minutes using the GeoSLAM ZEB Horizon and then processed in 15 minutes.
There's four steps to the GeoSLAM stockpile workflow: Data capture, processing, analysing and sharing. This workflow is set out below.
1: Data Capture
Capture your data quickly and easily with the GeoSLAM LiDAR scanners. There are three to choose from:
ZEB Go: 43,000 scan points per second; 30m range; post processing.
ZEB Revo RT: 43,000 scan points per second; 30m range; real-time processing.
ZEB Horizon: 300,000 scan points per second; 100m range; post-processing; can be drone mounted.
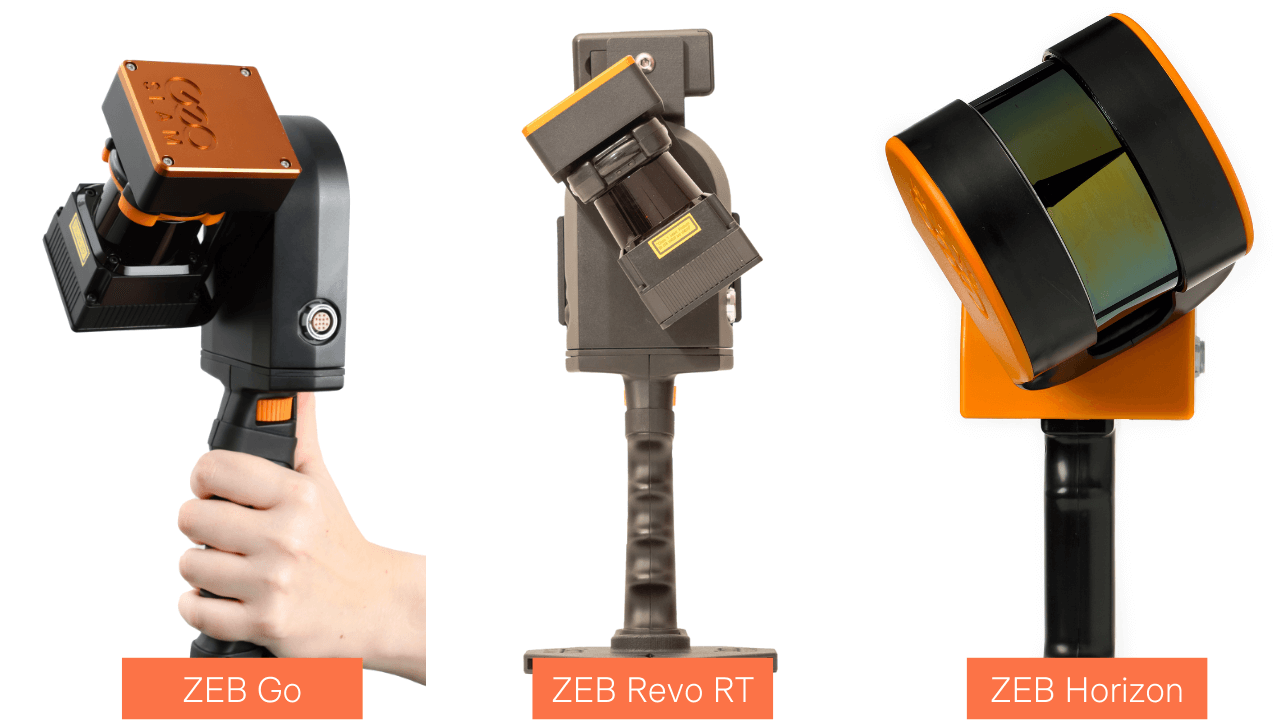
All three are handheld scanners. They can be pole or cradle-mounted to collect data from difficult-to-reach areas, while the ZEB Horizon can also be drone-mounted (including DJI M300 RTK and M600) or attached to a vehicle. Read our blog to find out more about the benefits of using a drone for stockpile measurements.

The ZEB Go, ZEB Revo RT, and ZEB Horizon can also be integrated with a range of other accessories to bolster the quality of the data, such as additional point-cloud colourisation and HD imagery.
Find out more about each GeoSLAM laser scanner and their accessory compatibility in our in-depth comparison article.
2: Data Processing In GeoSLAM Connect
Transfer the stockpile point cloud data to a computer and upload to the GeoSLAM Connect software to be automatically processed, then load the data to the GeoSLAM Volumes software for analysis.
GeoSLAM Connect comes free with each GeoSLAM LiDAR scanner.
3: Data Analysis In GeoSLAM Volumes
GeoSLAM Volumes automatically classifies and isolates the stockpile in a scan to filter and remove unwanted structures and noise within the survey area.
This eradicates the most time-consuming step of volumetric survey, data manipulation and preparation, and returns only the stockpile surface to give surveyors the data they need to track changes in volume and tonnage.
The stockpile can then be analysed: New scan data can be aligned to previously captured data to monitor change over time.
For instance, these images show a change of stockpile volume over time, with the bottom pile being slightly smaller than the top one. These stockpiles were each collected in one scan and automatically processed.

This data can also be shown in tabular form. For example, this graph, displaying absolute volume over time, shows how the stockpile increased and then reduced in size...
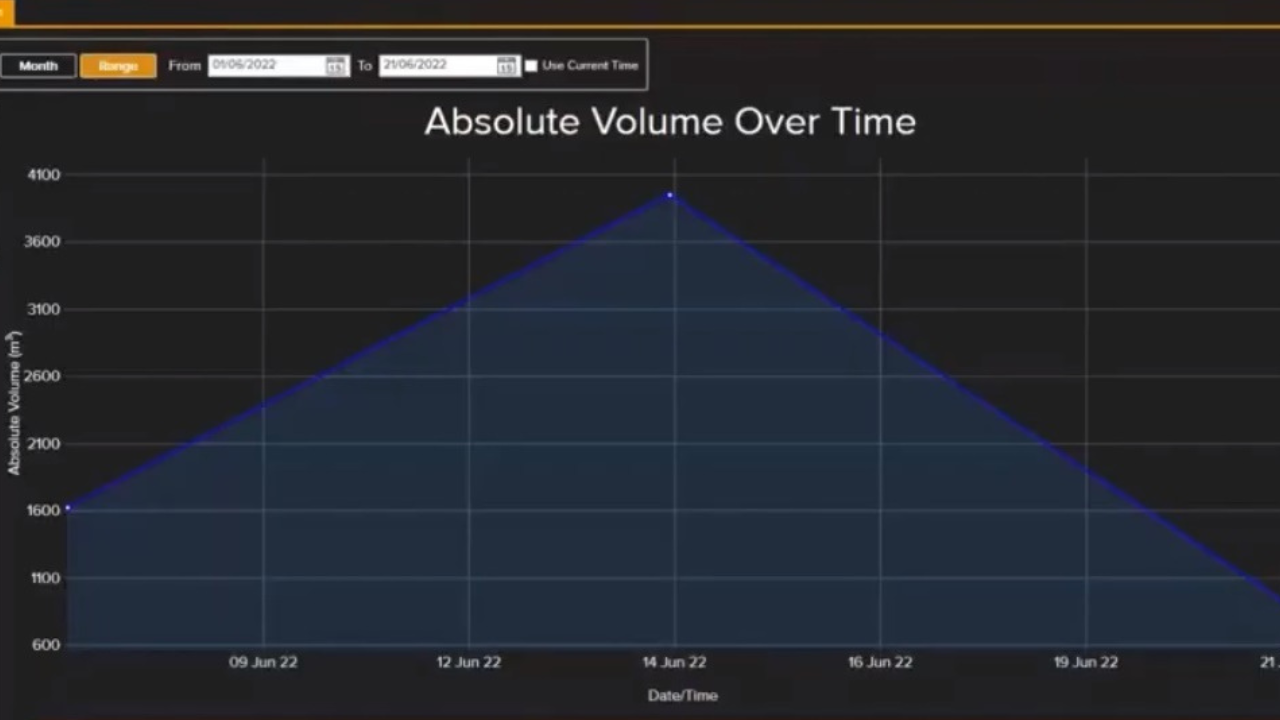
...while this graph shows the delta tonnage over time.
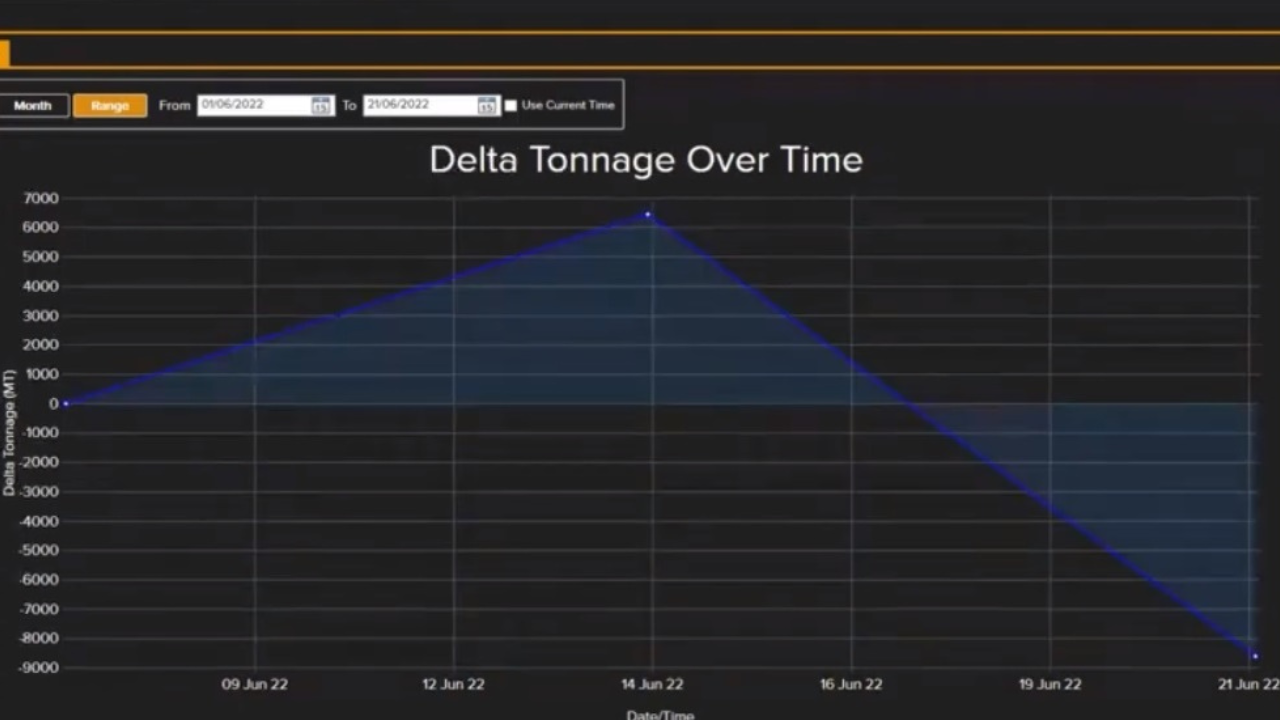
The stockpile data can be viewed by various parameters, such as date, cut factor, fill, net volume and difference.
4: Share
From here, generate a report that can be branded with your company logo and distributed to key stakeholders. Alternatively, the tabular data can be exported into a CSV file for further management assessment.
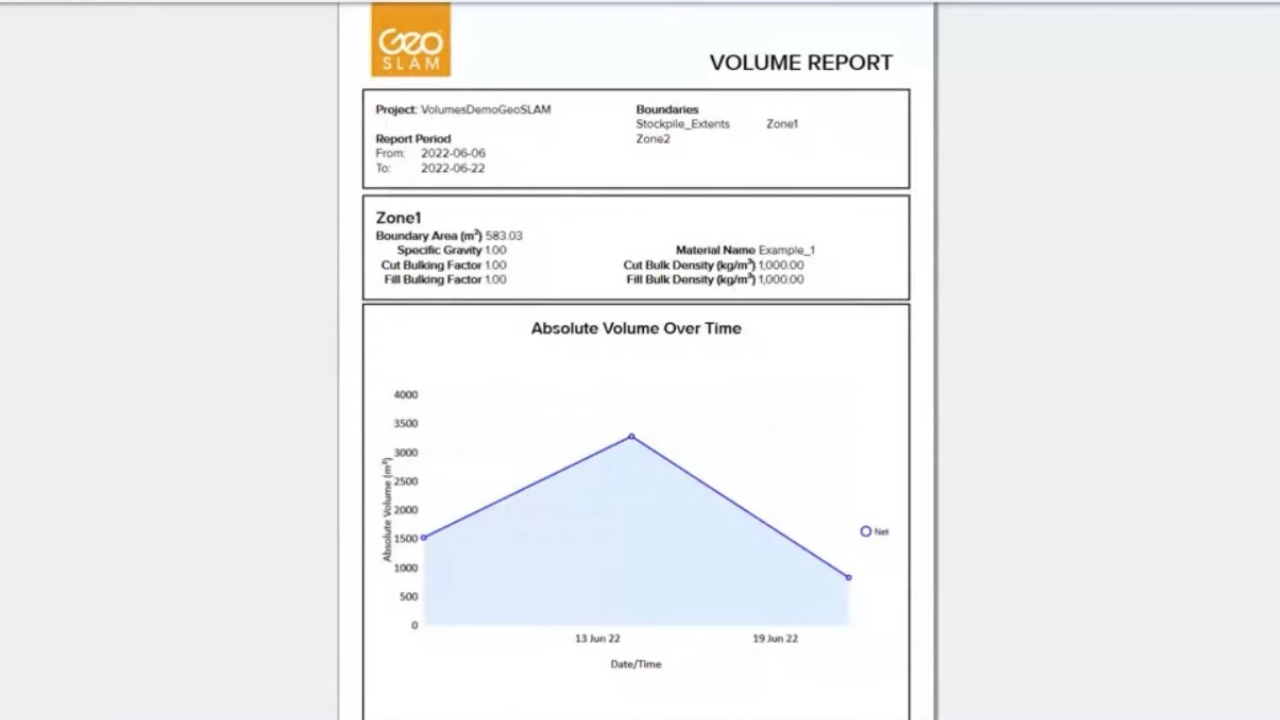
Use this information to increase project collaboration and share data to benefit site management and decision-making.
Summary
The GeoSLAM ecosystem provides an end-to-end workflow to benefit stockpile management.
Deploy GeoSLAM's LiDAR scanners to rapidly collect data to determine accurate stockpile volumes measurements, silo reserves or mining tempos, without the need for GPS.
A versatile solution, GeoSLAM's sensors enable surveyors to collect the data in a variety of ways: Walk and scan, or attach the scanner to a trolley, drone, pole, drone or vehicle for remote monitoring of hazardous environments.
GeoSLAM Volumes software then instantly turns data into actionable 3D information for rapid real-time decision making, which can be shared quickly and easily.
Stockpile measurements are crucial on any jobsite, and GeoSLAM provides reliable, accurate and efficient solutions to help this vital process.
Contact heliguy™ to discuss adding a GeoSLAM laser scanner to your workflows.
