Technical
White Paper: How Important Are GCPs For Drone Surveying?
Explore the critical role of Ground Control Points in enhancing drone surveying accuracy and learn best practices from the EuroSDR study.
White paper published, recording the accuracy of drone surveying with and without ground information;
Results reinforce the view that a number of strategically-placed GCPs are required to enhance drone survey accuracy;
EuroSDR study involved numerous stakeholders, including Newcastle University, heliguy™ and DJI Enterprise.
The results of an academic study to measure the accuracy of drone surveying in the absence of ground control and RTK GNSS correction have been published in a white paper.
The EuroSDR Commission 1 Benchmark was an independent evaluation of the true geometric quality of real-world survey data generated from Remotely Piloted Aircraft Systems (RPAS) when performed under different levels of control configuration.
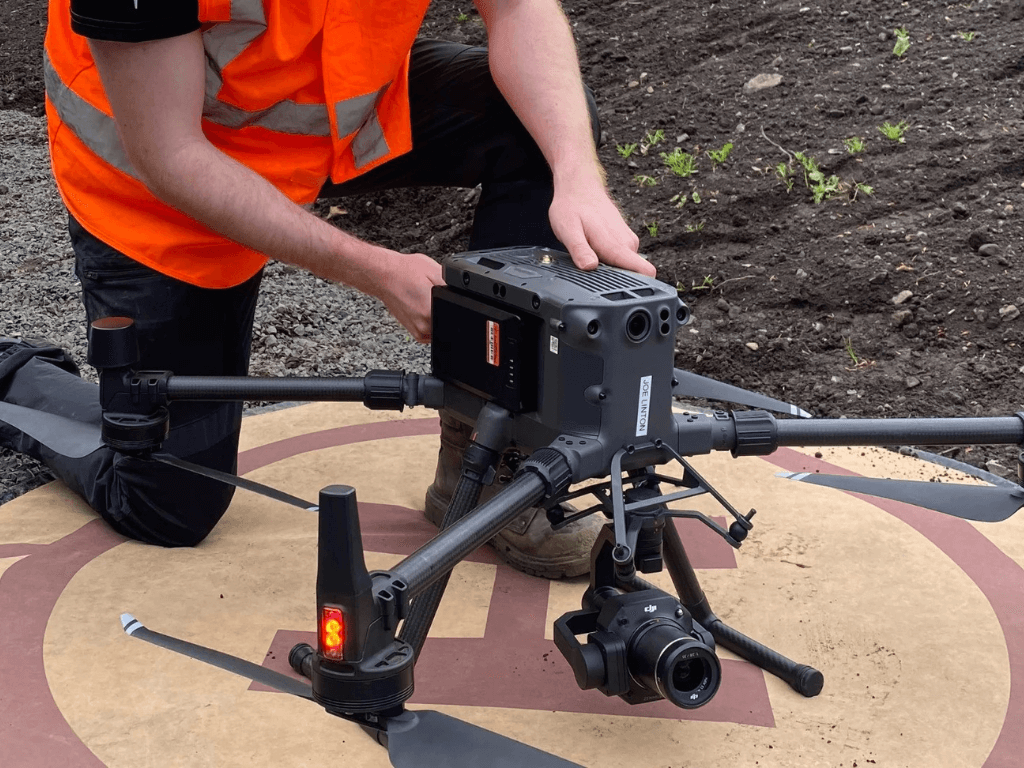
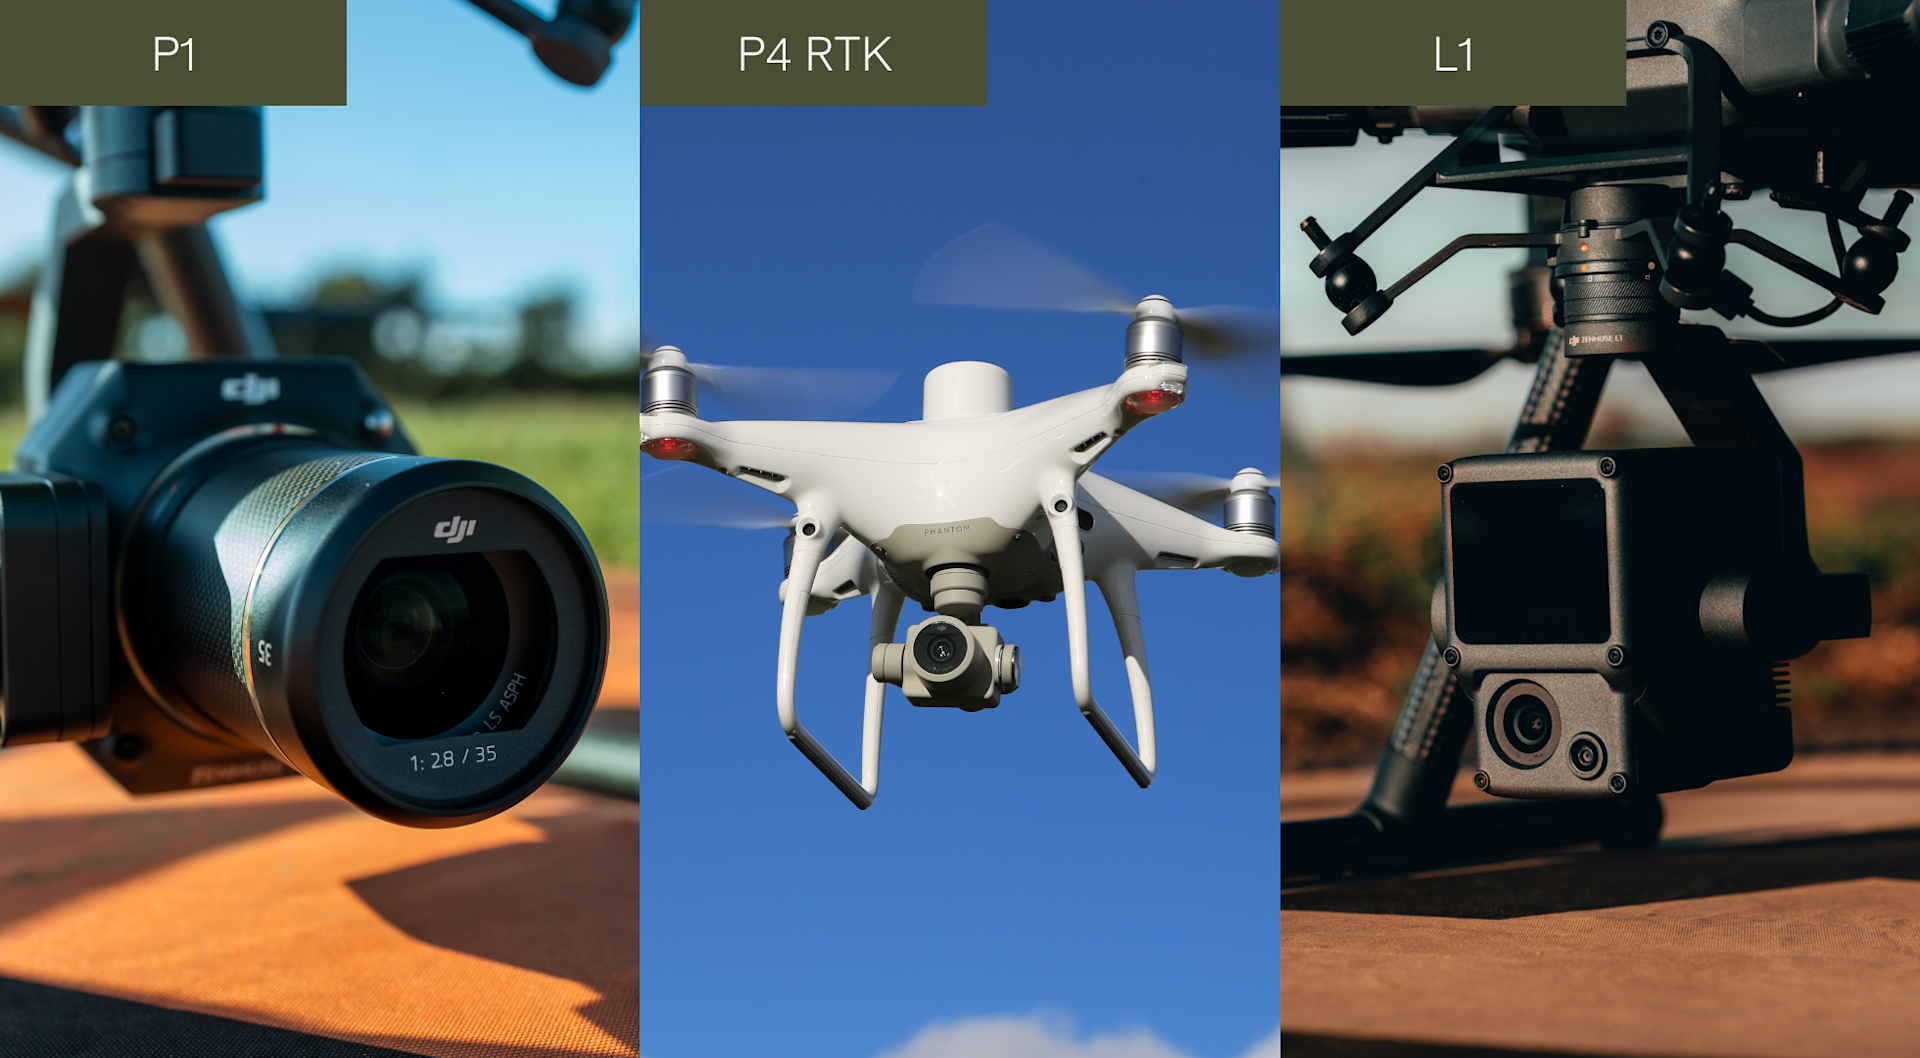
Funded by EuroSDR and involving numerous stakeholders - including Newcastle University, heliguy™ and DJI Enterprise - the project evaluated the resulting precisions and accuracies obtained with solutions such as the DJI Zenmuse P1 and L1 payloads (both integrated with the DJI M300 RTK for the study); and the DJI Phantom 4 RTK.

For photogrammetry, key findings included:
Depending on the payload, metre and decimetre-level accuracies were obtained in plan and height without any supporting ground information. Accuracy was worse than precision without any ground information.
Utilising RTK GNSS corrections provided cm-level precisions and accuracies, with some outliers.
The introduction of ground control points resulted in small improvements to the planimetric accuracy compared to the RTK solutions, but with more notable improvements in height (z axis).
The white paper states: 'The inclusion of GCPs still aids in the identification of errors, contributing to the reliability of such surveys.'
The findings endorse the importance of utilising strategically-placed GCPs during a drone photogrammetry survey, providing reference points with known coordinates to improve the quality of digital maps and survey data.
For more details on GCPs, read our Guide To Using GCPs blog.
heliguy™ has partnered with Emlid to offer its industry-leading range of RTK GNSS receivers to help in the process of placing GCPs. Emlid solutions can be deployed as a base and rover, or by utilising an NTRIP service to configure RTK using one Emlid GNSS receiver acting as a rover.
Survey In More Detail
The survey was conducted in August 2021. The data was then released across three phases.
Phase 1: Processing with no GCPs or GNSS base station information.
Phase 2: Processing with GNSS base station data and/or on-the-fly RTK corrections.
Phase 3: Processing with GCPs, and/or local GNSS base station, and/or on-the-fly RTK corrections.
Newcastle University processed all datasets for all of the phases.
The raw data from each survey then became progressively available to registered participants. At the end of each phase, participants were asked to submit 3D coordinates for the check points (CPs) and a brief description of their chosen processing pipeline/software solution.
In total, the benchmark evaluated 41 independent submissions, generated using real-world drone survey data, against GNSS-surveyed check points, a terrestrial laser scanning (TLS) survey, and total station height observations, all measured on a national coordinate system.
The subsequent results and white paper were published towards the end of 2023.
Test Site
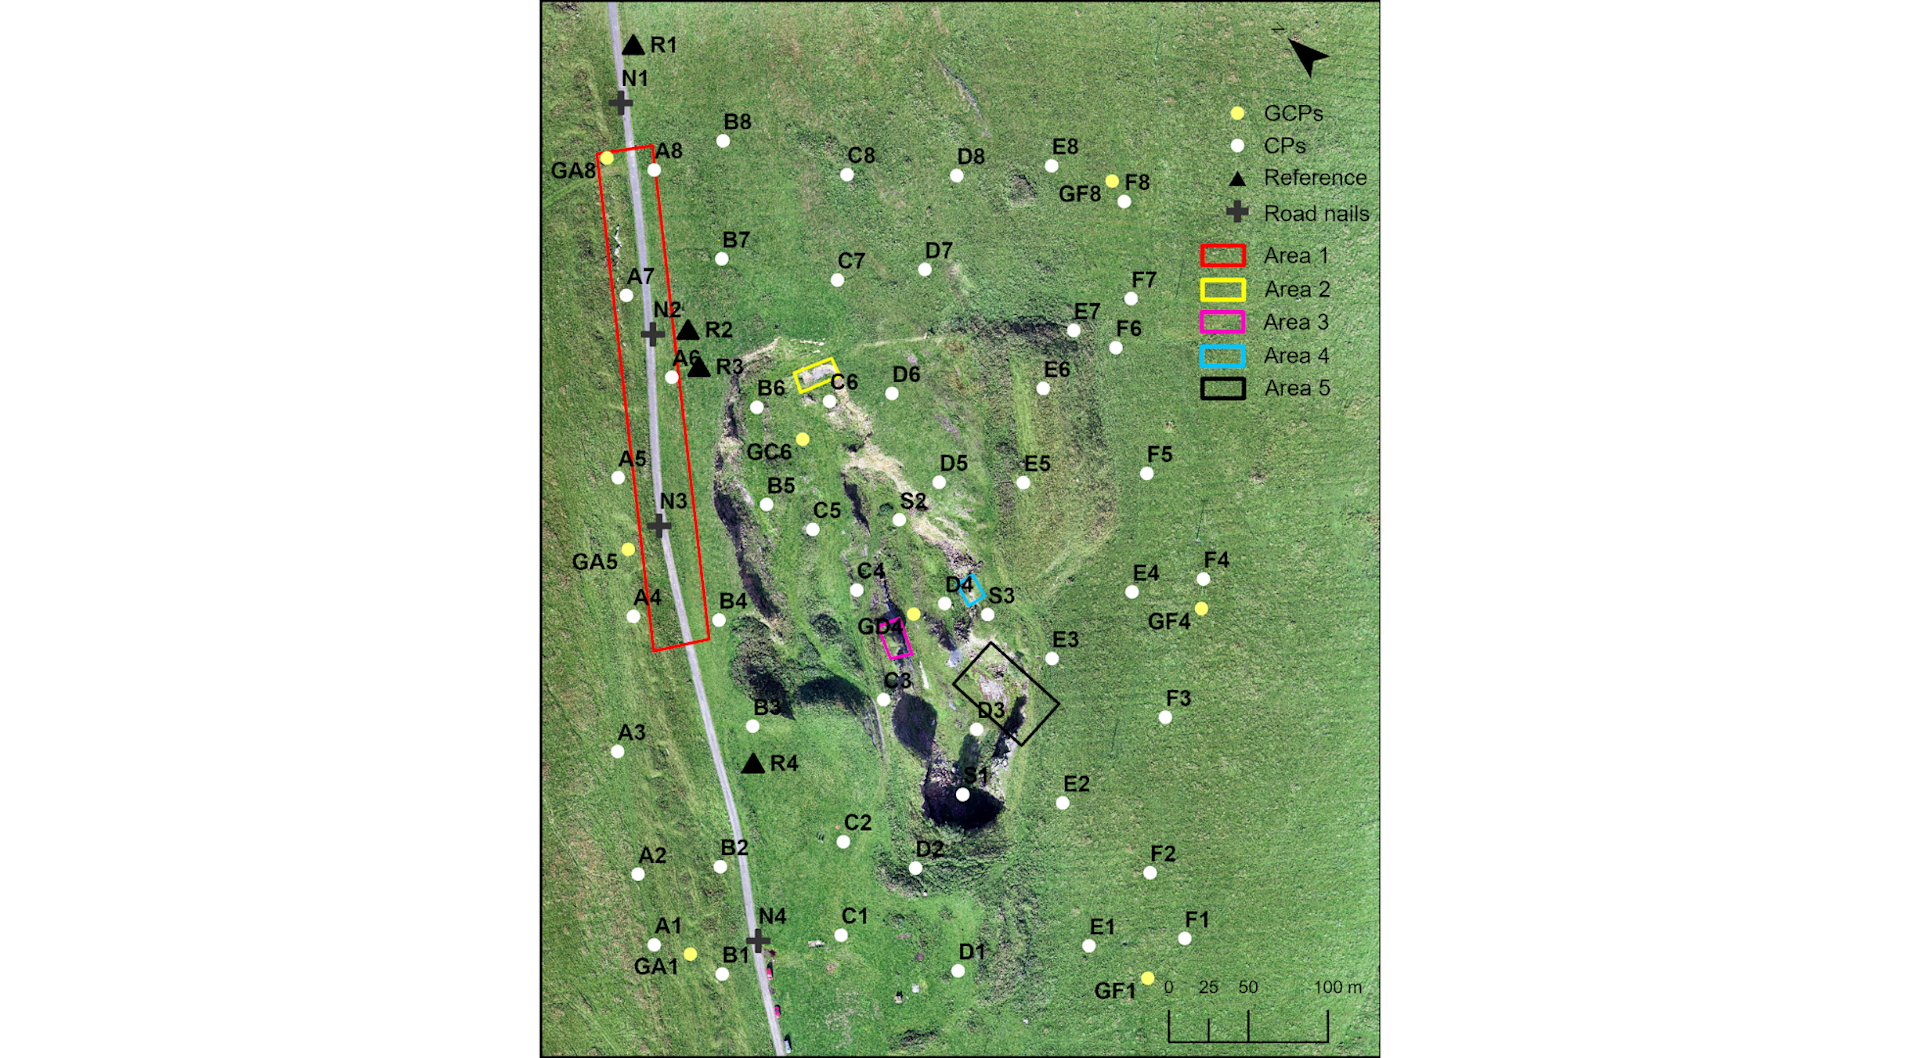
The study was conducted on a coordinated test field containing independent checkpoints (CPs), test surfaces and profiles at the disused Wards Hill Quarry near Morpeth, Northumberland, UK.

Eight GCPs and 51 CPs were used across the site of 350m x 250m in size - as shown in figure 1 below.

Equipment
The DJI P1, P4 RTK, and L1 were flown at heights ranging from 50m to 55m to collect data for the photogrammetric datasets.
For reference:
P1: 45MP full-frame sensor (35.9 x 24mm) with 4.4μm nominal pixel size. For the survey, it was set up with an automatic camera exposure and a continuous focus, capturing images with 80% forward and 70% lateral overlap.
P4 RTK: 1-inch, 20-megapixel CMOS sensor with 2.41 x 2.41μm nominal pixel size. For the survey, it was set up with a fixed exposure time and focus set to infinity, capturing images with 80% forward and 70% lateral overlap.
L1: 1-inch, 20MP CMOS RGB sensor with a 2.41 x 2.41μm nominal pixel size. For the survey, it was set up to fly with a 50% lateral overlap.
It's worth noting that since the survey, the P4 RTK has been superseded by the DJI Mavic 3 Enterprise, while the L2 is an upgraded version of the L1. The M3E and L2 have enhanced capabilities to increase surveying efficiency, accuracy and precision, compared to their predecessors.
For more details, read our Mavic 3 Enterprise vs Phantom 4 RTK comparison, or our L2 vs L1 guide.
Results - Photogrammetry
The main takeaway from the study was the value of incorporating on-the-fly RTK and/or local base station, with the inclusion of GCPs.
For instance, the table below - showing the photogrammetric results from the L1 - demonstrates how the data improved with RTK GNSS corrections, and then again by deploying GCPs, with a particular improvement in height data.
Phase | Standard Deviation (m) | RMSE (m) |
1 | Easting: 0.113 Northing: 0.093 Height: 0.142 | Easting: 0.374 Northing: 0.916 Height: 1.345 |
2 | Easting: 0.009 Northing: 0.009 Height: 0.035 | Easting: 0.745 Northing: 0.389 Height: 1.033 |
3 | Easting: 0.008 Northing: 0.007 Height: 0.025 | Easting: 0.009 Northing: 0.007 Height: 0.028 |
The white paper states that when the L1 was processed solely as a photogrammetric dataset, cm-level accuracy (c. 1x GSD in plan and 1.5x GSD in height) was delivered with the inclusion of GCPs. The L1 also obtained 0.018 m GSD from 50m altitude.
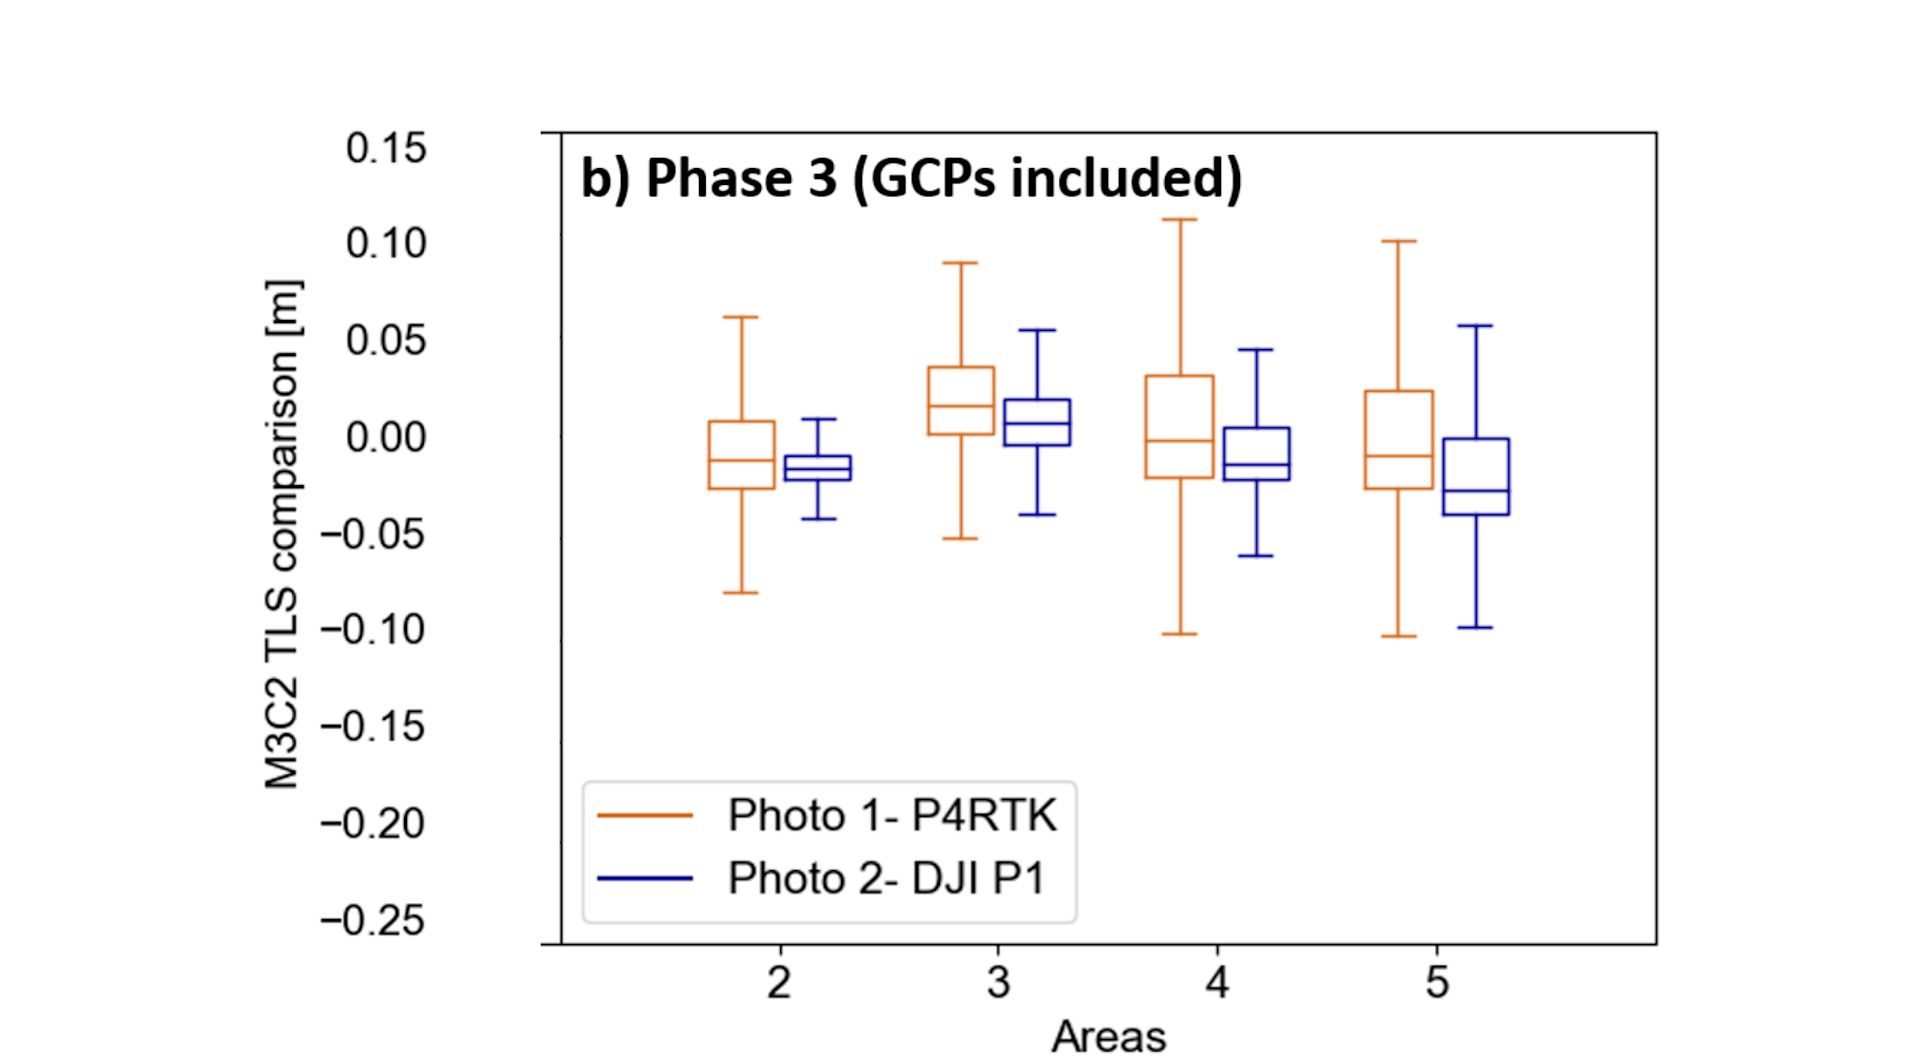
The survey also endorsed the enhanced quality of the P1 as a drone photogrammetry solution compared to the older generation Phantom 4 RTK.
For instance, the DJI P1 output showed smaller discrepancies against the TLS data compared to the P4 RTK, as the graphic below (figure 2) demonstrates.

The results also showed:
Without any ground control or RTK, the P1 obtained decimetre-level accuracies in plan and height, compared to the P4 RTK's metre-level accuracy, with a few outliers.
P4 RTK delivered planimetric accuracy approximate to 1x GSD (0.020m) at Phases 2 (with RTK corrections) and 3 (with GCPs), while the P1 achieved a better GSD of 0.007m with GCPs.
Indicative results showed that the P1 achieved a point cloud density of 1310 pts/m² on flat terrain on asphalt and 1320 pts/m² on bare rock with no vegetation, compared to the P4 RTK's point cloud density of 200 pts/m² across the same surfaces.
In conclusion to the photogrammetric surveys, the white paper states: 'Multiple submissions from participants have allowed some interesting conclusions to be drawn.
'In photogrammetric processing, Phase 1, conducted without any ground control or local base station, saw submissions deliver c. m-level (and dm-level) solutions where accuracy was much worse than precision.
'In Phase 2, with RTK GNSS correction available, accuracy and precision were seen to be more equal, with solutions at the cm-level, but prone to datum effects in both plan and height that, without GCPs (i.e. Phase 3) might not be evident in a real-world survey.
'Finally, in Phase 3, the introduction of GCPs returns the highest level of precision and accuracy (~1x GSD), albeit only slightly improved over Phase 2.
'Outliers occurred at all three stages, highlighting the continued importance of following an appropriate processing flow line with camera calibration, coordinate transformations, etc., particularly in the modern era of “black box” SfM photogrammetry. The inclusion of GCPs still aids in the identification of such errors, so contributing to the reliability of such surveys.'
Results - LiDAR
During the study, the quality of LiDAR data captured by the DJI L1 and the Riegl MiniVUX (integrated with the DJI M600 drone for the test) were also compared.
DJI L1: Features a Livox LiDAR scanner with GNSS and inertial navigation system. Each flight consisted of 13 parallel flight lines with a 50% lateral overlap, conducted at 50m above ground, and engaging a 160 kHz sampling rate in a repetitive scanning pattern supporting a maximum of 3 echo returns.
Riegl MiniVUX: Comprised two GNSS NovAtel receivers/antennas, one IMU SPAN Airborne EKINOX by SBG Systems, and a Riegl MiniVUX-1 LiDAR unit. It was flown at 60m above the take-off location at 6 m/s, following five parallel lines and two cross strips, scanning with a 280m swath width at 20% reflectance.
Results found that the L1's point cloud density was superior to the Riegl MiniVUX, as shown by the table below which displays indicative examples of the varying point cloud densities.
Area | L1 | Riegl MiniVUX |
1 ( flat terrain on asphalt) | 1020 pts/m² | 120 pts/m² |
5 (bare rock, no vegetation) | 1120 pts/m² | 100 pts/m² |
The L1 was also able to generate a DEM (Digital Elevation Model) with a 0.05m spatial resolution, compared to the Riegl MiniVUX's 0.125m spatial resolution.
However, despite its coarser spatial resolution, the Riegl solution was shown to produce smaller errors than the L1.
For instance, the graphic below (figure 3) shows how, at a cross-section over Area 5, the L1 point cloud was found to be 0.15m below the TLS and the Riegl MiniVUX point clouds.

But the white paper does state: 'It should be noted that the R1 GNSS base station was used to process the Riegl MiniVUX RPAS trajectory, and that may explain why it resulted in better accuracies compared to the commercial RTK solution of the DJI L1.'
It adds that, at the time of the data processing, the DJI Terra software did not incorporate GCPs (it does now), hence the DJI L1 output solely relied on the RTK corrections provided by a commercial service.
It is also worth considering that Riegl solutions are generally a more expensive option compared to DJI payloads.
Future
The EuroSDR RPAS benchmark datasets are now openly available online in order to support and facilitate further investigation by the community.
To facilitate and encourage wider use of the EuroSDR RPAS Benchmark, the full dataset has now been made open access via Zenodo (10.5281/zenodo.8309679).
To read the full white paper, click here.
Figures 1-3 were taken from the white paper: Mills, et al. 2023. THE EUROSDR RPAS BENCHMARK: OPEN DATASET DESCRIPTION AND SUMMARY OF KEY RESULTS, Int. Arch. Photogramm. Remote Sens. Spatial Inf. Sci., XLVIII-1/W3-2023, 107–114, https://doi.org/10.5194/isprs-archives-XLVIII-1-W3-2023-107-2023
